

Differentiating the effects of fine and coarse particles on daily mortality in Shanghai, China
- PMID: 17229464
- PMCID: PMC2094002
- DOI: 10.1016/j.envint.2006.12.001
Differentiating the effects of fine and coarse particles on daily mortality in Shanghai, China
Abstract
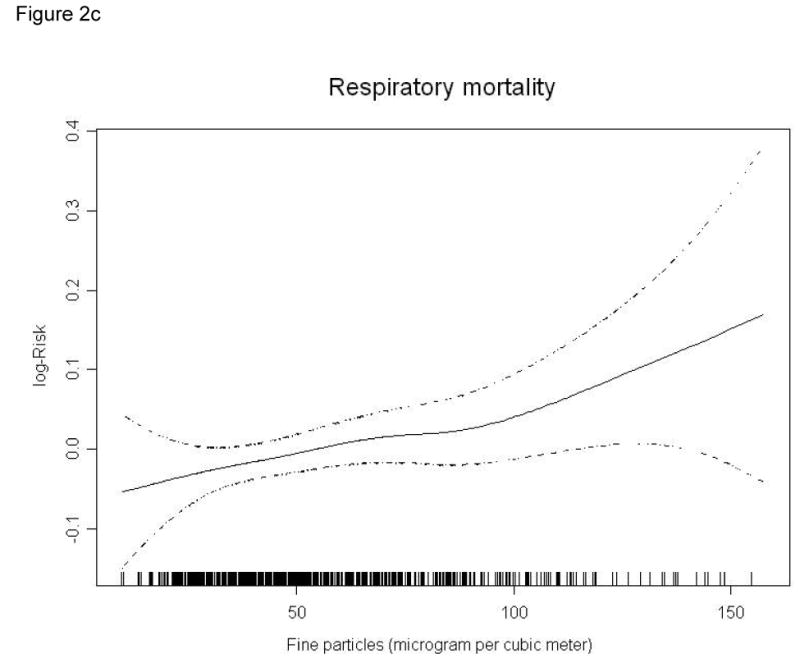
The findings on health effects of ambient fine particles (PM2.5) and coarse particles (PM10-2.5) remain inconsistent. In China, PM2.5 and PM10-2.5 are not the criteria air pollutants, and their monitoring data are scarce. There have been no epidemiological studies of health effects of PM2.5 and PM10-2.5 simultaneously in China. We conducted a time series study to examine the acute effects of PM2.5 and PM10-2.5 on daily mortality in Shanghai, China from Mar. 4, 2004 to Dec. 31, 2005. We used the generalized additive model (GAM) with penalized splines to analyze the mortality, air pollution and covariate data. The average concentrations of PM2.5 and PM10-2.5 were 56.4 microg/m3 and 52.3 microg/m3 in our study period, and PM2.5 constituted around 53.0% of the PM10 mass. Compared with the Global Air Quality Guidelines set by World Health Organization (10 microg/m3 for annual mean) and U.S. National Ambient Air Quality Standards (15 microg/m3 for annual mean), the PM2.5 level in Shanghai was much higher. We found that PM2.5 was associated with the death rates from all causes and from cardiorespiratory diseases in Shanghai. We did not find a significant effect of PM10-2.5 on mortality outcomes. A10 microg/m3 increase in the 2-day moving average (lag01) concentration of PM2.5 corresponded to 0.36% (95% CI 0.11%, 0.61%), 0.41% (95% CI 0.01%, 0.82%) and 0.95% (95% CI 0.16%, 1.73%) increase of total, cardiovascular and respiratory mortality. For PM10-2.5, the effects were attenuated and less precise. Our analyses provide the first statistically significant evidence in China that PM2.5 has an adverse effect on population health and strengthen the rationale for further limiting levels of PM2.5 in outdoor air in Shanghai.
Figures


Similar articles
-
Part 1. A time-series study of ambient air pollution and daily mortality in Shanghai, China.Res Rep Health Eff Inst. 2010 Nov;(154):17-78. Res Rep Health Eff Inst. 2010. PMID: 21446211
-
Part 2. Association of daily mortality with ambient air pollution, and effect modification by extremely high temperature in Wuhan, China.Res Rep Health Eff Inst. 2010 Nov;(154):91-217. Res Rep Health Eff Inst. 2010. PMID: 21446212
-
Multicity study of air pollution and mortality in Latin America (the ESCALA study).Res Rep Health Eff Inst. 2012 Oct;(171):5-86. Res Rep Health Eff Inst. 2012. PMID: 23311234
-
Short-term exposure to particulate matter (PM10 and PM2.5), nitrogen dioxide (NO2), and ozone (O3) and all-cause and cause-specific mortality: Systematic review and meta-analysis.Environ Int. 2020 Sep;142:105876. doi: 10.1016/j.envint.2020.105876. Epub 2020 Jun 23. Environ Int. 2020. PMID: 32590284
-
Health effects of outdoor air pollution. Committee of the Environmental and Occupational Health Assembly of the American Thoracic Society.Am J Respir Crit Care Med. 1996 Jan;153(1):3-50. doi: 10.1164/ajrccm.153.1.8542133. Am J Respir Crit Care Med. 1996. PMID: 8542133 Review.
Cited by
-
Acute effect of fine particulate matter and respiratory mortality in Changsha, China: a time-series analysis.BMC Pulm Med. 2022 Nov 12;22(1):416. doi: 10.1186/s12890-022-02216-3. BMC Pulm Med. 2022. PMID: 36368963 Free PMC article.
-
Chronic fine and coarse particulate exposure, mortality, and coronary heart disease in the Nurses' Health Study.Environ Health Perspect. 2009 Nov;117(11):1697-701. doi: 10.1289/ehp.0900572. Epub 2009 Jun 15. Environ Health Perspect. 2009. PMID: 20049120 Free PMC article.
-
An observation-based perspective of winter haze days in four major polluted regions of China.Natl Sci Rev. 2019 May;6(3):515-523. doi: 10.1093/nsr/nwy118. Epub 2018 Oct 17. Natl Sci Rev. 2019. PMID: 34691900 Free PMC article.
-
Apparent temperature and air pollution vs. elderly population mortality in Metro Vancouver.PLoS One. 2011;6(9):e25101. doi: 10.1371/journal.pone.0025101. Epub 2011 Sep 28. PLoS One. 2011. PMID: 21980381 Free PMC article.
-
Exploring the Cellular Impact of Size-Segregated Cigarette Aerosols: Insights into Indoor Particulate Matter Toxicity and Potential Therapeutic Interventions.Chem Res Toxicol. 2024 Jul 15;37(7):1171-1186. doi: 10.1021/acs.chemrestox.4c00114. Epub 2024 Jun 13. Chem Res Toxicol. 2024. PMID: 38870402 Free PMC article.
References
-
- Anderson HR, Bremner SA, Atkinson RW, Harrison RM, Walters S. Particulate matter and daily mortality and hospital admissions in the west midlands conurbation of the United Kingdom: associations with fine and coarse particles, black smoke and sulphate. Occup Environ Med. 2001;58(8):504–510. - PMC - PubMed
-
- Bell ML, Samet JM, Dominici F. Time-series studies of particulate matter. Annu Rev Public Health. 2004;25:247–280. - PubMed
-
- Braga AL, Zanobetti A, Schwartz J. The lag structure between particulate air pollution and respiratory and cardiovascular deaths in 10 US cities. J Occup Environ Med. 2001;43(11):927–933. - PubMed
Publication types
MeSH terms
Substances
Grants and funding
LinkOut - more resources
Full Text Sources
Research Materials
