. 2007 Mar;35(1):9-15.
doi: 10.1016/j.neuroimage.2006.11.053. Epub 2007 Jan 16.

Internet-enabled high-resolution brain mapping and virtual microscopy

Affiliations

Internet-enabled high-resolution brain mapping and virtual microscopy

Shawn Mikula et al. Neuroimage. 2007 Mar.

Abstract

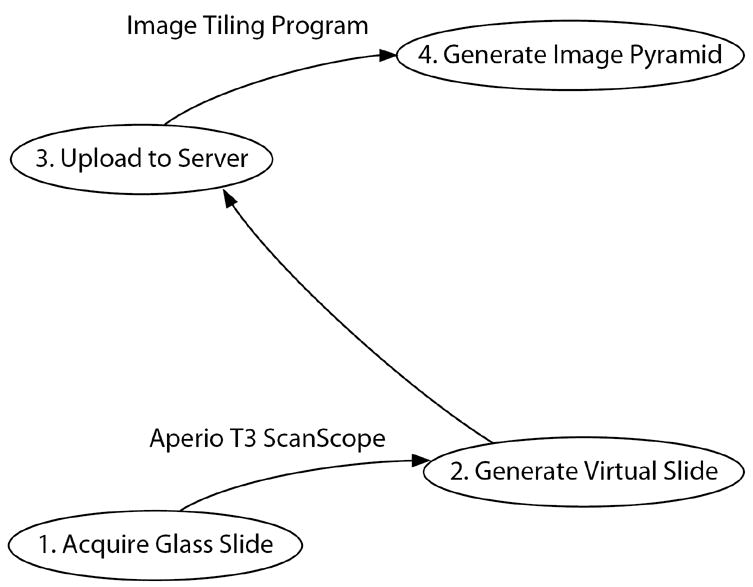
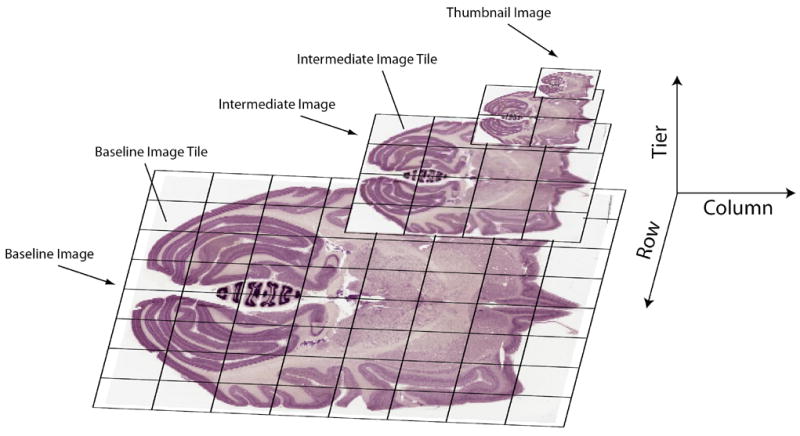
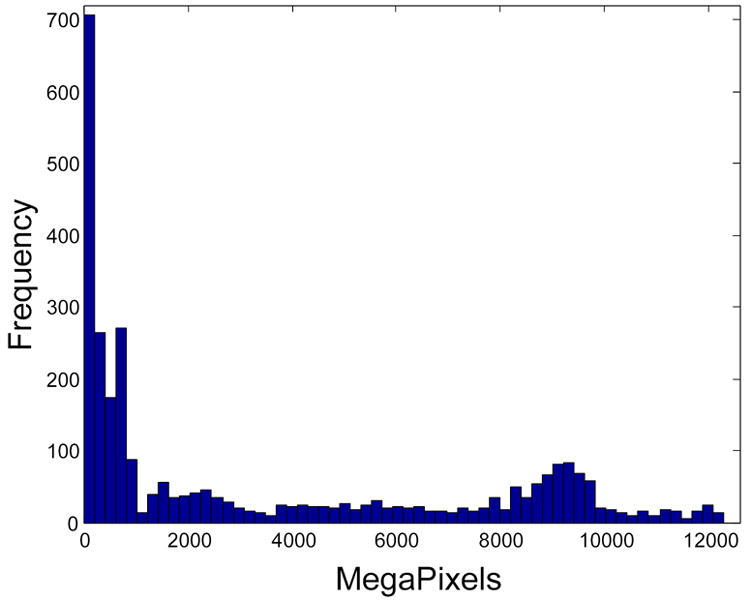
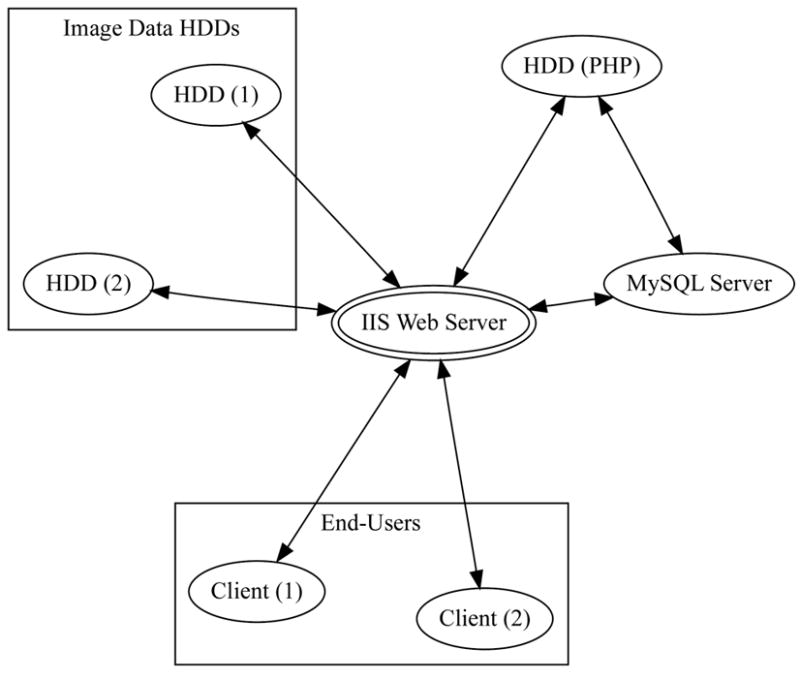
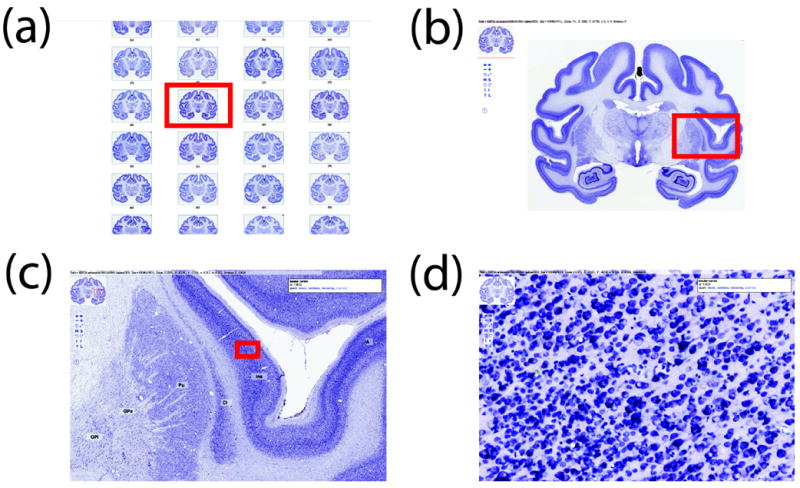
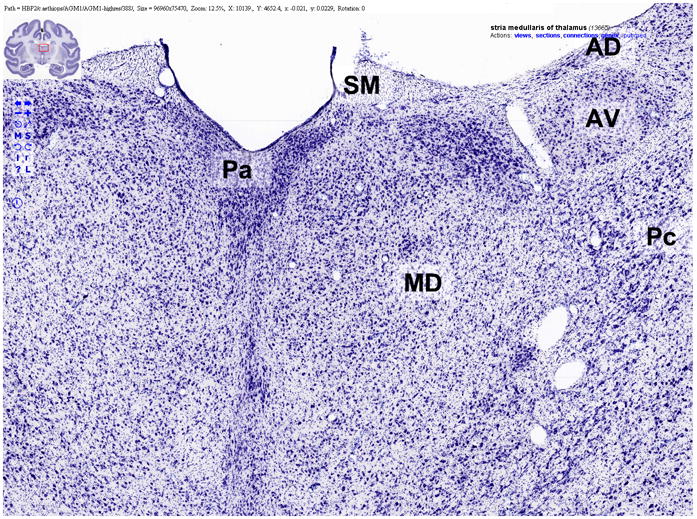
Virtual microscopy involves the conversion of histological sections mounted on glass microscope slides to high-resolution digital images. Virtual microscopy offers several advantages over traditional microscopy, including remote viewing and data sharing, annotation, and various forms of data mining. We describe a method utilizing virtual microscopy for generation of internet-enabled, high-resolution brain maps and atlases. Virtual microscopy-based digital brain atlases have resolutions approaching 100,000 dpi, which exceeds by three or more orders of magnitude resolutions obtainable in conventional print atlases, MRI, and flat-bed scanning. Virtual microscopy-based digital brain atlases are superior to conventional print atlases in five respects: (1) resolution, (2) annotation, (3) interaction, (4) data integration, and (5) data mining. Implementation of virtual microscopy-based digital brain atlases is located at BrainMaps.org, which is based on more than 10 million megapixels (35 terabytes) of scanned images of serial sections of primate and non-primate brains with a resolution of 0.46 microm/pixel (55,000 dpi). The method can be replicated by labs seeking to increase accessibility and sharing of neuroanatomical data. Online tools offer the possibility of visualizing and exploring completely digitized sections of brains at a sub-neuronal level and can facilitate large-scale connectional tracing, histochemical, and stereological analyses.


Figures

Figure 1
Figure 1
High-throughput virtual microscopy. Block diagram outlining the major steps in going from immunocytochemically or histochemically processed slide-mounted tissue to a web-accessible image pyramid.
Figure 2
Figure 2
The concept behind an image pyramid. Each virtual slide, representing a single monolithic image file, is chopped up (i.e., tiled) to generate a multi-resolution image pyramid composed of small image tiles with a maximum size of 256 × 256 pixels. Image pyramids allow for rapid online navigation through very large images by loading only the image tiles that are currently being viewed.
Figure 3
Figure 3
Distribution of image sizes at BrainMaps.org as of 09-25-2006. The total size of the brain images is 10,569,936 MegaPixels, or 31.71 TeraBytes. The total number of images is 3035, with an average size of 3482.68 MegaPixels/image (or 10.45 GigaBytes/image).
Figure 4
Figure 4
Server organization. The client interacts with the server through a Flash or Java based frontend that interacts with the image file system and relational database. The active scripting language, PHP, is used as a ‘glue’ to tie all the components together.
Figure 5
Figure 5
An example of navigation through virtual slides at brainmaps.org using the African green monkey Nissl dataset. All images are actual screenshots from a web browser and are what a visitor to brainmaps.org would see. (a) An array of virtual slides for the dataset, shown as clickable thumbnails that, when clicked on, launch a new browser window allowing navigation through the high-resolution image (b). The image in (b) is 95,040 × 74,711 pixels and 20 gigabytes in size. The thumbnail in the upper left is for navigation purposes. Shown also are overlying labels of brain areas that may be toggled on and off. (c) Zooming in on the slide in (b). The red box in (b) corresponds to (c). (d) Zooming in to full resolution in (c), showing details of individual neurons in the insula. The red box in (c) corresponds to (d).
Figure 6
Figure 6
An example of a Flash-based graphical user interface for viewing high-resolution neuroanatomical images at BrainMaps.org. Note the overlaying labels (“Pa”, “MD”, “AD”, “AV”, “Pc”, and “SM”) and the label-specific context menu in the upper right that enables the user to retrieve related information, including the position of the label in the labeling hierarchy, connectivity, and patterns of gene expression.
Figure 7
Figure 7
2D scatter plot with marginal histograms showing tile fetch times (in ms) on the Y-axis and tile sizes (in kb) on the X-axis. The number of data points is 1000 and corresponds to a random selection of tiles in an image pyramid for a single monkey section of size 95,040 × 74,061 pixels. The mean image tile fetch time is 84.4 ms and the mean image tile size is 4.11 kb.

References

    1. Afework A. Digital Dynamic Telepathology: The Virtual Microscope. University of Maryland; 1998. - PMC - PubMed
    1. Berman AL. The Brain Stem of the Cat. University of Wisconsin Press; 1968.
    1. Berman AL, Jones EG. The thalamus and basal telencephalon of the cat: a cytoarchitectonic atlas with stereotaxic coordinates. University of Wisconsin Press; 1982.
    1. Bowden D, Martin R. NeuroNames Brain Hierarchy. Neuroimage. 1995;2(1):63–83. - PubMed
    1. Emmers R, Akert K. A Stereotaxic Atlas of the Brain of the Squirrel Monkey (Saimiri Sciureus. Madison: Univ. of Wisconsin Press; 1963.

Publication types