

Continuous polyelectrolyte adsorption under an applied electric potential
- PMID: 17229849
- PMCID: PMC1783114
- DOI: 10.1073/pnas.0603874104
Continuous polyelectrolyte adsorption under an applied electric potential
Abstract
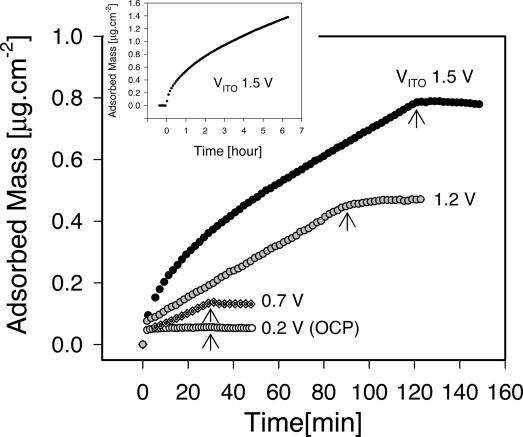
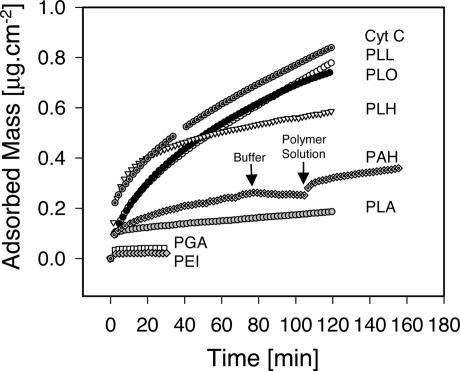
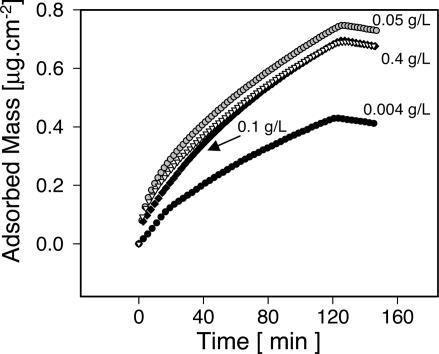
Interactions between charged macromolecules (e.g., proteins, nucleic acids, polyelectrolytes) and charged surfaces govern many natural and industrial processes. We investigate here the influence of an applied electric potential on the adsorption of charged polymers, and report the following significant result: the adsorption of certain amine side chain-containing polycations may become continuous, i.e., asymptotically linear (or nearly linear) in time over hours, upon the application of a modest anodic potential. Employing optical waveguide lightmode spectroscopy (OWLS) and an indium tin oxide (ITO) substrate, we show that asymptotic kinetics, and the adsorbed mass at the onset of the asymptotic regime, depend sensitively on polymer chemistry (in particular, side chain volume and charge location), increase with applied potential and ionic strength (conditions favoring a thicker initial layer), and are independent of bulk polymer concentration (suggesting postadsorption events to be rate limiting). X-ray photoelectron spectra reveal a suppressed polymer charge within layers formed via continuous adsorption, but no evidence of electrochemical reactions. We propose a mechanism based on polymer-polymer binding within the adsorbed layer, enabled by suppressed electrostatic repulsion and/or enhanced ionic correlations near the conducting surface, and stabilized by short-range attractive interactions. Continuous adsorption under an applied electric potential offers the possibility of nanoscale films of tailored polymer content realized in a single step.
Conflict of interest statement
The authors declare no conflict of interest.
Figures
Similar articles
-
Polyelectrolyte adsorption kinetics under an applied electric potential: Strongly versus weakly charged polymers.J Colloid Interface Sci. 2009 Jan 15;329(2):222-7. doi: 10.1016/j.jcis.2008.10.014. Epub 2008 Oct 14. J Colloid Interface Sci. 2009. PMID: 18977002
-
In situ layer-by-layer film formation kinetics under an applied voltage measured by optical waveguide lightmode spectroscopy.Langmuir. 2005 Jun 21;21(13):5865-71. doi: 10.1021/la050066d. Langmuir. 2005. PMID: 15952835
-
Electrochemical optical waveguide lightmode spectroscopy (EC-OWLS): a pilot study using evanescent-field optical sensing under voltage control to monitor polycationic polymer adsorption onto indium tin oxide (ITO)-coated waveguide chips.Biotechnol Bioeng. 2003 May 20;82(4):465-73. doi: 10.1002/bit.10591. Biotechnol Bioeng. 2003. PMID: 12632403
-
Polymer adsorption and electrokinetic potential of dispersed particles in weak and strong electric fields.Adv Colloid Interface Sci. 2015 Aug;222:58-69. doi: 10.1016/j.cis.2014.09.009. Epub 2014 Nov 18. Adv Colloid Interface Sci. 2015. PMID: 25456453 Review.
-
Formation of polyelectrolyte-surfactant complexes on surfaces.Adv Colloid Interface Sci. 2006 Nov 16;123-126:105-23. doi: 10.1016/j.cis.2006.07.005. Epub 2006 Oct 2. Adv Colloid Interface Sci. 2006. PMID: 17011507 Review.
Cited by
-
Characterization of an L-α,β-diaminopropionic acid polymer with comb-like structure isolated from a poly(ε-L-lysine)-producing Streptomyces sp.Appl Microbiol Biotechnol. 2021 Apr;105(8):3145-3157. doi: 10.1007/s00253-021-11257-3. Epub 2021 Apr 12. Appl Microbiol Biotechnol. 2021. PMID: 33846822
-
Electrical microcurrent to prevent conditioning film and bacterial adhesion to urological stents.Urol Res. 2011 Apr;39(2):81-8. doi: 10.1007/s00240-010-0284-3. Epub 2010 Aug 5. Urol Res. 2011. PMID: 20686759
-
Virucidal N95 Respirator Face Masks via Ultrathin Surface-Grafted Quaternary Ammonium Polymer Coatings.ACS Appl Mater Interfaces. 2022 Jun 8;14(22):25135-25146. doi: 10.1021/acsami.2c04165. Epub 2022 May 25. ACS Appl Mater Interfaces. 2022. PMID: 35613701 Free PMC article.
References
-
- Cohen Stuart MA, Fleer GJ, Lyklema J, Norde W, Scheutjens JMHM. Adv Colloid Interface Sci. 1991;34:477–535. - PubMed
-
- Fleer GJ, Cohen Stuart MA, Scheutjens JMHM, Cosgrove T, Vincent B. Polymers at Interfaces. London: Chapman and Hall; 1993.
-
- Decher G, Schlenoff JB. Multilayer Thin Films. Weinheim, Germany: Wiley-VCH; 2003.
-
- Hammond PT. Adv Mat. 2004;16:1271–1293.
-
- Hoogeveen NG, Cohen Stuart MA, Fleer GJ. J Colloid Interface Sci. 1996;182:133–145.
Publication types
MeSH terms
Substances
Grants and funding
LinkOut - more resources
Full Text Sources
