. 2007 Feb;22(1):14-25.
doi: 10.1177/0748730406296319.

Gates and oscillators II: zeitgebers and the network model of the brain clock

Affiliations

Gates and oscillators II: zeitgebers and the network model of the brain clock

Michael C Antle et al. J Biol Rhythms. 2007 Feb.

Abstract

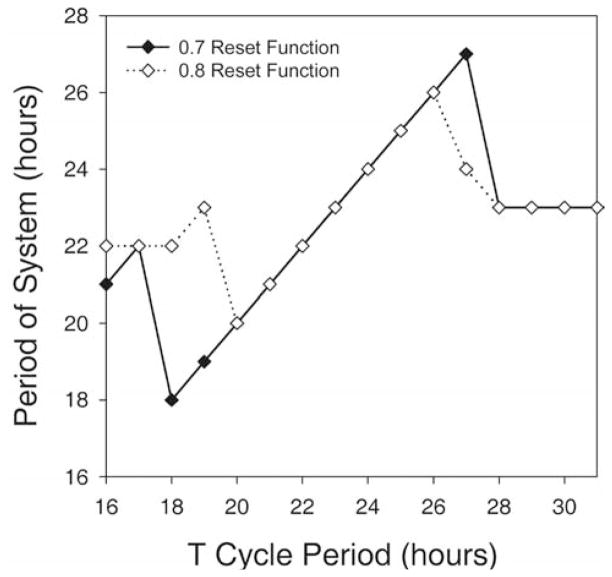
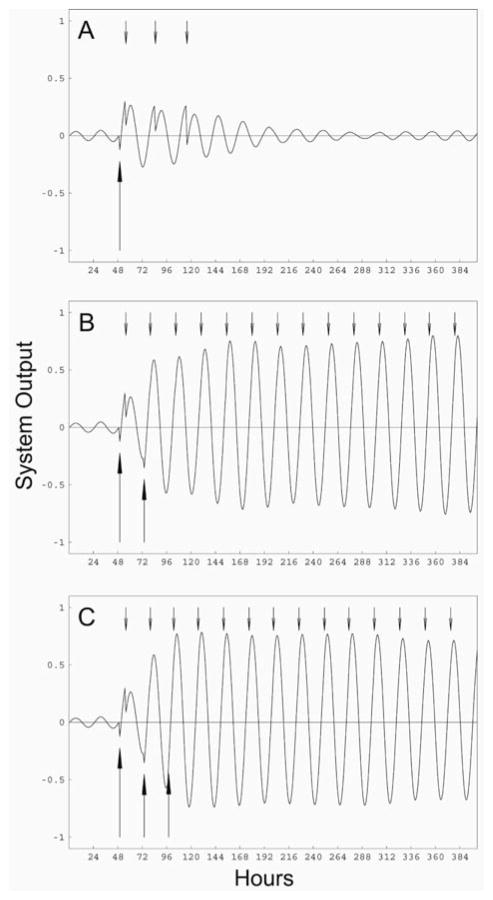
Circadian rhythms in physiology and behavior are regulated by the SCN. When assessed by expression of clock genes, at least 2 distinct functional cell types are discernible within the SCN: nonrhythmic, light-inducible, retinorecipient cells and rhythmic autonomous oscillator cells that are not directly retinorecipient. To predict the responses of the circadian system, the authors have proposed a model based on these biological properties. In this model, output of rhythmic oscillator cells regulates the activity of the gate cells. The gate cells provide a daily organizing signal that maintains phase coherence among the oscillator cells. In the absence of external stimuli, this arrangement yields a multicomponent system capable of producing a self-sustained consensus rhythm. This follow-up study considers how the system responds when the gate cells are activated by an external stimulus, simulating a response to an entraining (or phase-setting) signal. In this model, the authors find that the system can be entrained to periods within the circadian range, that the free-running system can be phase shifted by timed activation of the gate, and that the phase response curve for activation is similar to that observed when animals are exposed to a light pulse. Finally, exogenous triggering of the gate over a number of days can organize an arrhythmic system, simulating the light-dependent reappearance of rhythmicity in a population of disorganized, independent oscillators. The model demonstrates that a single mechanism (i.e., the output of gate cells) can account for not only free-running and entrained rhythmicity but also other circadian phenomena, including limits of entrainment, a PRC with both delay and advance zones, and the light-dependent reappearance of rhythmicity in an arrhythmic animal.


Figures

Figure 1
Figure 1
Resetting function that describes how the phase of an individual oscillator is reset by the gate. Phase is indicated over a range from 0 to 2π along both the x and y axes. The dashed line represents the function for no change in phase. The solid black line represents the resetting function employed in all simulations. Solid grey lines show phase of intersect and maximum change. This function was selected as it is similar to our previously validated function (Antle et al., 2003) but includes a more physiological connection between the maximal phase delays and advances near the 2π → 0 transition. The individual oscillators’ phase decreases as time increases. Therefore, later phases are represented at the left of the x-axis and bottom of the y-axis, while earlier phases are represented at the right of the x-axis and top of the y-axis. Thus, portions of the reset function below the null-reset function advance the phase of individual oscillators, while portions above the null-reset function delay them.
Figure 2
Figure 2
Resetting the ensemble with a single light pulse. (A–C) Actograms derived from the output of the model. Each horizontal line represent one 24-h period, with successive “days” plotted below the previous day. White circles represent the acrophase for each individual cycle. The width of the horizontal line is proportional to the amplitude of the system output. White diamonds represent the phase at which the gate was triggered exogenously, simulating a discrete “light pulse.” Regression lines were fit to the acrophases both before and after the light pulse. (D) A phase response curve constructed from light pulses presented at 1 of 24 consecutive hours. Shifts depicted in panels A to C are indicated by letters and arrows referencing the solid line. Solid line represents shifts to the reset function in Figure 1, while the dashed line represents shifts to a weaker function with a slope of 0.8 instead of 0.7.
Figure 3
Figure 3
Entrainment of the ensembles by simulated daily light pulses. Double-plotted actograms derived from the output of the model are presented. Ensembles with mean periods of (A) 22 h or (B) 26 h were allowed to oscillate undisturbed for about 12 cycles, after which the gate was triggered exogenously at the same time every 24 h. This persisted for 13 cycles, after which the systems were allowed to free run.
Figure 4
Figure 4
Representative actograms depicting limits of entrainment. The period of the applied T cycle (the frequency with which the gate was exogenously triggered) is presented, as is the period of the system (τ), as calculated by cosine spectrum analysis. The systems were allowed to free run for about 12 cycles before the T cycle was applied (using the resetting function with a slope of 0.7). The T cycle was applied for about 12 cycles (indicated by the diagonal gray lines on the actograms), after which the system was allowed to free run again.
Figure 5
Figure 5
Relationship between applied T cycle period and the resulting period of the system (τ), as determined by cosine spectrum analysis. The solid line represents the τ produced using the reset function with a slope of 0.7 (Fig. 1), while the dashed line indicates the τ produced using the weaker function with a slope of 0.8.
Figure 6
Figure 6
Simulation of restarting the circadian system following emergence from hibernation. Each simulation was performed with 200 oscillators with periods that were normally distributed with a mean of 24 h and a standard deviation of 1.5 h. The initial phases of the oscillators were uniformly distributed between 0 and 2π. Large upward arrows denote the times that the gate was exogenously triggered, simulating light exposure. Small downward arrows denote the times that the gate was endogenously triggered by the output of the ensemble of oscillators. The gate was exogenously triggered (A) once, (B) twice, or (C) 3 times.

Comment in

  • Gate cells see the light.
    Welsh DK. Welsh DK. J Biol Rhythms. 2007 Feb;22(1):26-8. doi: 10.1177/0748730406297067. J Biol Rhythms. 2007. PMID: 17229922 No abstract available.

References

    1. Albers HE, Liou SY, Stopa EG, Zoeller RT. Interaction of colocalized neuropeptides: Functional significance in the circadian timing system. J Neurosci. 1991;11:846–851. - PMC - PubMed
    1. Antle MC, Foley DK, Foley NC, Silver R. Gates and oscillators: A network model of the brain clock. J Biol Rhythms. 2003;18:339–350. - PMC - PubMed
    1. Antle MC, Kriegsfeld LJ, Silver R. Signaling within the master clock of the brain: Localized activation of mitogen-activated protein kinase by gastrin-releasing peptide. J Neurosci. 2005;25:2447–2454. - PMC - PubMed
    1. Antle MC, Silver R. Orchestrating time: Arrangements of the brain circadian clock. Trends Neurosci. 2005;28:145–151. - PubMed
    1. Aton SJ, Colwell CS, Harmar AJ, Waschek J, Herzog ED. Vasoactive intestinal polypeptide mediates circadian rhythmicity and synchrony in mammalian clock neurons. Nat Neurosci. 2005;8:476–483. - PMC - PubMed

Publication types

LinkOut - more resources