. 2007 Mar;8(3):195-211.
doi: 10.1111/j.1600-0854.2006.00524.x.

Host ABCE1 is at plasma membrane HIV assembly sites and its dissociation from Gag is linked to subsequent events of virus production

Affiliations

Host ABCE1 is at plasma membrane HIV assembly sites and its dissociation from Gag is linked to subsequent events of virus production

Julia E Dooher et al. Traffic. 2007 Mar.

Abstract

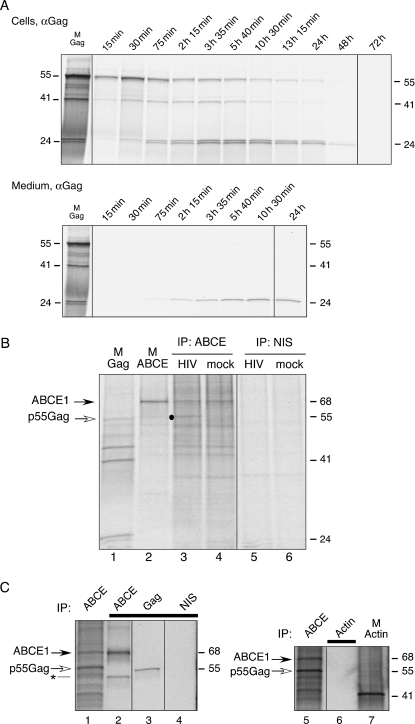
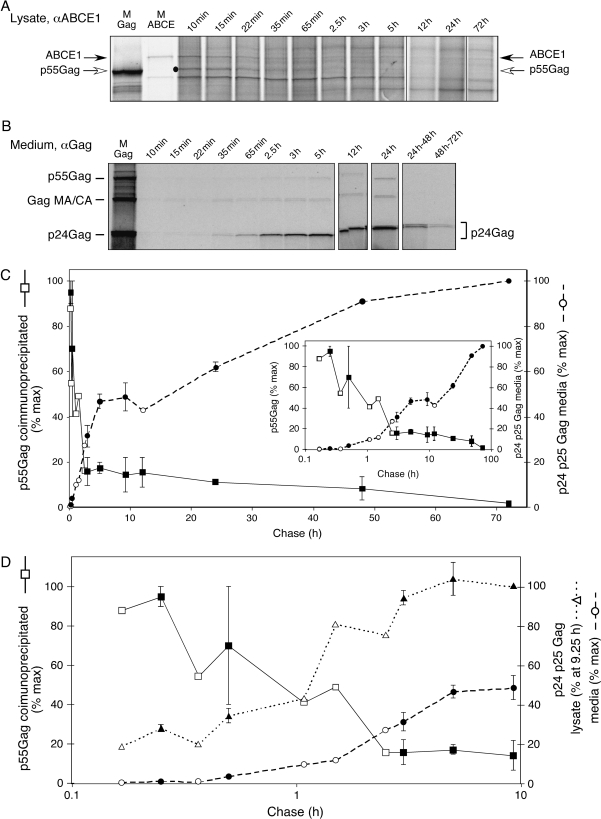
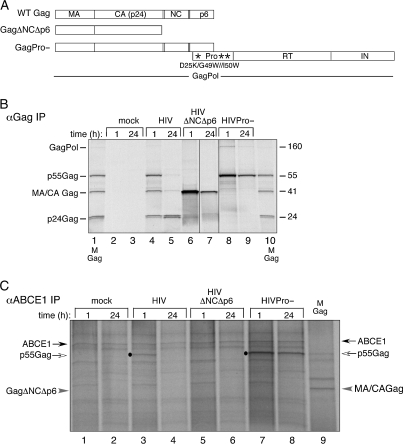
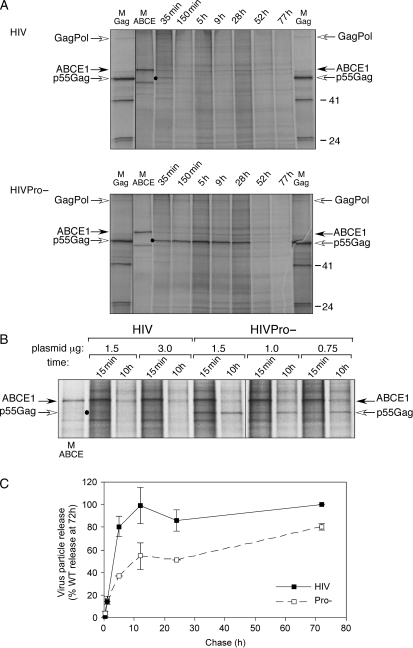
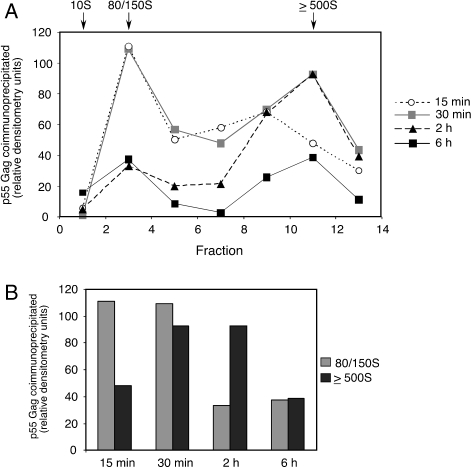
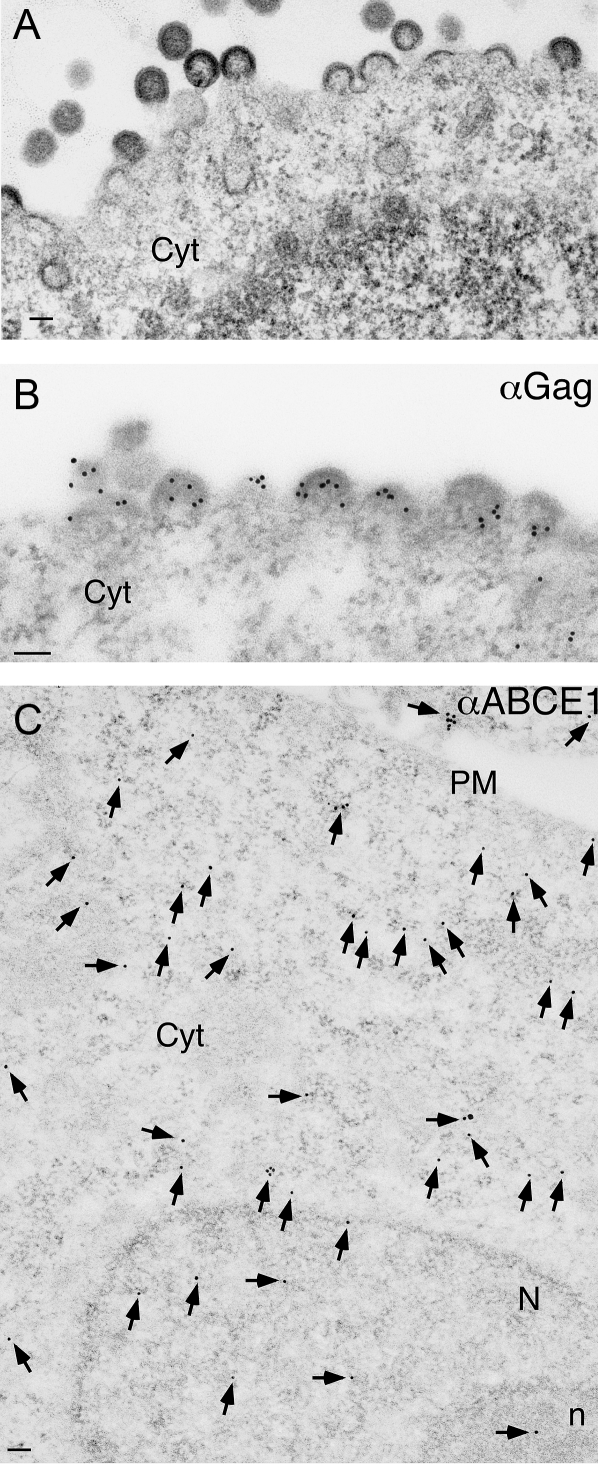
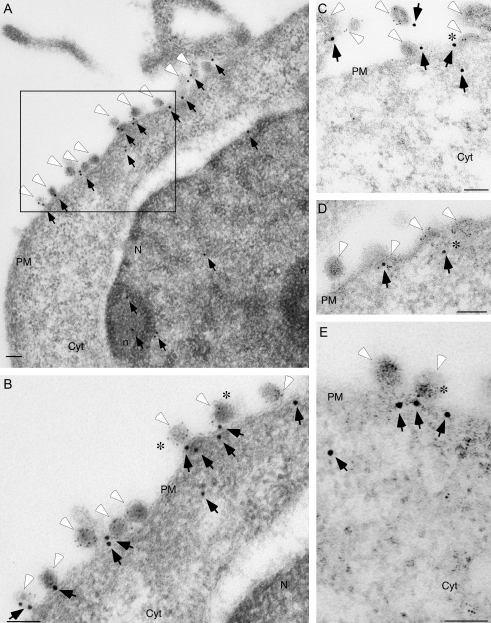
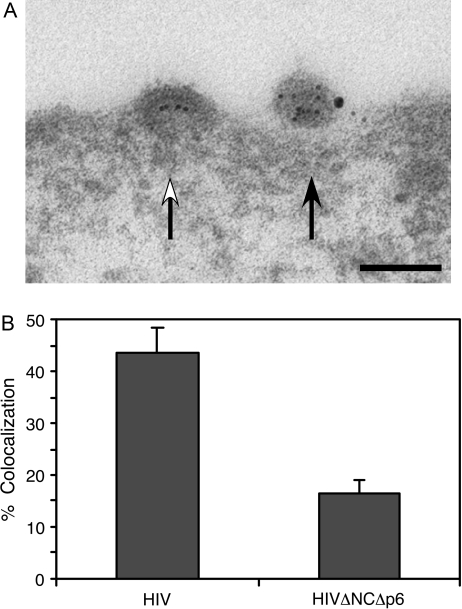
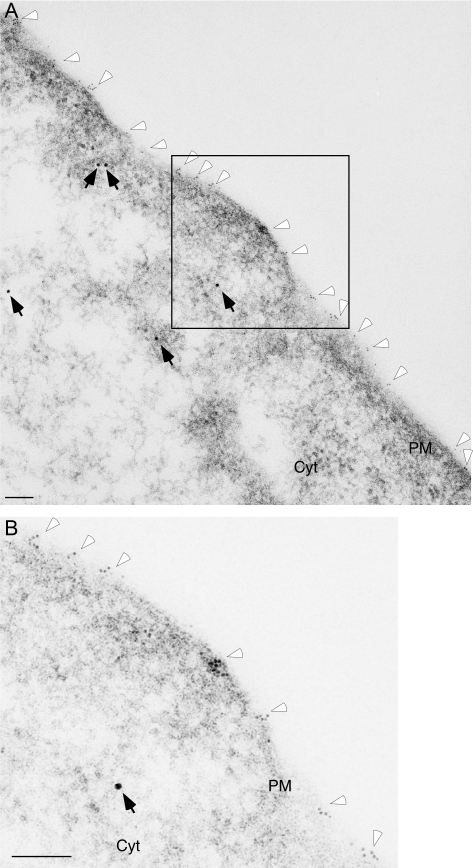
In primate cells, assembly of a single HIV-1 capsid involves multimerization of thousands of Gag polypeptides, typically at the plasma membrane. Although studies support a model in which HIV-1 assembly proceeds through complexes containing Gag and the cellular adenosine triphosphatase ABCE1 (also termed HP68 or ribonuclease L inhibitor), whether these complexes constitute true assembly intermediates remains controversial. Here we demonstrate by pulse labeling in primate cells that a population of Gag associates with endogenous ABCE1 within minutes of translation. In the next approximately 2 h, Gag-ABCE1 complexes increase in size to approximately that of immature capsids. Dissociation of ABCE1 from Gag correlates closely with Gag processing during virion maturation and occurs much less efficiently when the HIV-1 protease is inactivated. Finally, quantitative double-label immunogold electron microscopy reveals that ABCE1 is recruited to sites of assembling wild-type Gag at the plasma membrane but not to sites of an assembly-defective Gag mutant at the plasma membrane. Together these findings demonstrate that a population of Gag present at plasma membrane sites of assembly associates with ABCE1 throughout capsid formation until the onset of virus maturation, which is then followed by virus release. Moreover, the data suggest a linkage between Gag-ABCE1 dissociation and subsequent events of virion production.


Figures

Figure 1:
Figure 1:. Sequential immunoprecipitation validates the finding that radiolabeled p55Gag associates with ABCE1
A) COS-1 cells expressing HIV-1 were pulsed for 6 min with 35S-methionine/cysteine and chased with unlabeled medium for 15 min to 72 h as indicated. Cell lysates (A, top panel) and medium (A, bottom panel) were harvested, denatured, and subjected to immunoprecipitation with αGag. Marker lane (M Gag) indicates the position of full-length Gag and Gag cleavage products. B) COS-1 cells transfected with HIV (lanes 3 and 5) or mock plasmid (lanes 4 and 6) were pulsed for 45 min with 35S-methionine/cysteine and chased with unlabeled medium for 15 min. Lysates were subjected to immunoprecipitation under native conditions with αABCE1 (IP: ABCE) or nonimmune serum (IP: NIS). Lanes 1 and 2 are marker lanes (M) that indicate the position of Gag and ABCE1. Dot indicates position of coimmunoprecipitated p55Gag in lane 3. C) COS-1 cells expressing HIV were pulsed for 1 h with 35S-methionine/cysteine and chased with unlabeled medium for 15 min. Lysates were subjected to native immunoprecipitation with αABCE1 (ABCE, lanes 1 and 5), and eluates from these initial immunoprecipitations were programmed into a second round of immunoprecipitations, indicated with black bar, using αABCE1 (lane 2), αGag (lane 3), nonimmune antibody (lane 4) or actin antibody (lane 6). Marker indicates position of actin (M actin, lane 7). Asterisk indicates position in lane 2 of a frequently seen ∼45-kD band that cross-reacts with αABCE1. Molecular weight markers or positions of ABCE1 or Gag are indicated beside all panels. All lanes in a given panel are from the same autoradiograph, with dividing lines indicating where lanes from other regions of the same autoradiograph are spliced. All data are representative of four independent experiments.
Figure 2:
Figure 2:. Intracellular complexes containing radiolabeled Gag and ABCE1 appear shortly after translation and disappear upon intracellular processing of radiolabeled p55Gag
A) COS-1 cells expressing HIV-1 were pulsed for 15 min with 35S-methionine/cysteine and chased with unlabeled media. At chase times indicated above panels, cells were harvested and lysates were subjected to immunoprecipitation under native conditions with αABCE1. Dot indicates position of coimmunoprecipitated p55Gag. B) Collections of medium at chase times indicated were subjected to immunoprecipitation with αGag. Medium collections in the first 24 h were cumulative, starting with the beginning of the chase period, while medium collected at later times shows p24Gag release during intervals (24–48 h and 48–72 h). Marker lanes (M Gag, M ABCE) show the positions of p55Gag and ABCE1. All lanes are from the same autoradiograph, with lanes spliced from elsewhere on the same autoradiograph indicated by dividing line. C) The amount of radiolabeled p55Gag coimmunoprecipitated with αABCE1 in A was quantitated as percentage of maximum (squares, left-hand y-axis) and was plotted against the amount of radiolabeled Gag (p24Gag and p25Gag) present in medium in B as percentage of maximum radiolabeled p24Gag and p25Gag accumulated at 72-h chase (circles, right-hand y-axis). Inset shows data with chase time plotted on a logarithmic scale in order to highlight early time-points. D) Data shown in C are plotted against increase in processed Gag bands (p24Gag and p25Gag) from cell lysates (triangles, right-hand y-axis) and against the amount of radiolabeled Gag (p24Gag and p25Gag) present in medium as in C (circles, right-hand y-axis). Graph shows data with chase time plotted on a logarithmic scale in order to highlight early time-points (up to 9.25-h chase). Accumulation of processed p24Gag and p25Gag bands in lysate (triangles, right-hand y-axis) was quantitated as percentage p24Gag and p25Gag present at maximum intracellular levels (9.25 h). Processed Gag bands in the media were quantitated as percentage of maximum radiolabeled p24Gag and p25Gag accumulated at 72-h chase (circles, right-hand y-axis). C,D) When identical time-points were available in two experiments (filled squares, circles or triangles), data were averaged, with error bars showing SEM. Open squares, circles and triangles show time-points that were only examined in one of the two experiments. All data are representative of four independent experiments.
Figure 3:
Figure 3:. Wild-type HIV-1 Gag associates with ABCE1 transiently, while Gag from HIVΔNCΔp6 fails to associate with ABCE1, and Gag from HIVPro− shows prolonged association with ABCE1
A) Schematic of HIV constructs used. Gag encodes matrix (MA), capsid (CA), nucleocapsid (NC) and p6, while GagPol also encodes the HIV enzymes protease (Pro), reverse transcriptase (RT) and integrase (IN). Asterisks indicate sites of point mutations in HIVPro− construct. B,C) COS-1 cells transfected with the indicated constructs were pulsed for 1 h with 35S-methionine/cysteine and chased with unlabeled media. Lysates were harvested at 1 or 24 h into the chase period (as indicated) and were immunoprecipitated with αGag after denaturation (B) or with αABCE1 under native conditions (C). Markers for GagPol, p55Gag and Gag cleavage products (MA/CA Gag, p24Gag) are shown (M Gag), and positions of ABCE1, p55Gag and GagΔNCΔp6 are indicated by black, white and gray arrows, respectively in (C). Dots show the position of coimmunoprecipitated p55Gag in lanes 3, 7 and 8. All lanes in a given panel are from the same autoradiograph, with dividing lines indicating where lanes from other regions of the same autoradiograph are spliced. Data are representative of three independent experiments.
Figure 4:
Figure 4:. Time-course demonstrates prolonged ABCE1 association with Gag from HIVPro− and reduced rate of HIVPro− particle release
A) COS-1 cells expressing 3.0 μg HIV or HIVPro− were radiolabeled for 15 min with 35S-methionine/cysteine and chased with unlabeled media. At indicated times, cells were harvested and subjected to immunoprecipitation under native conditions with αABCE1. Markers (M) for the position of Gag and ABCE1 are shown. Dot shows the position of coimmunoprecipitated p55Gag in chase lanes. B) COS-1 cells transfected with indicated amounts of HIV or HIVPro− plasmid (μg) were pulsed for 15 min with 35S-methionine/cysteine and chased for 15 min or 10 h with unlabeled media. Lysates were subjected to native immunoprecipitation with αABCE1. Dot shows the position of coimmunoprecipitated p55Gag in chase lanes. Data are representative of three independent experiments. C) VLPs from cells transfected with 1.5 μg wild-type HIV (filled squares) or HIVPro− (open squares) plasmid were prepared using sucrose cushions, and amount of radiolabeled Gag was quantitated and graphed as a percentage of total wild-type virus release. Total wild-type virus release was defined as the amount of wild-type virus accumulated in the medium at 72 h into the chase. Data are averaged from two independent experiments, and error bars indicate SEM. Native immunoprecipitations were performed on cell lysates in C (data not shown) and were similar to 1.5 μg lanes shown in B.
Figure 5:
Figure 5:. Intracellular complexes containing Gag and ABCE1 increase to approximately the size of capsids over time
COS-1 cells expressing HIV-1 were subjected to pulse radiolabeling for 15 min followed by chase with unlabeled medium. At indicated times, cells were harvested and subjected to velocity sedimentation, fractionation and immunoprecipitation under native conditions with αABCE1. A) p55Gag associated with ABCE1 in fractions representing ∼10S ∼80/150S and ≥500S complexes was quantitated and shown as assembly profiles. Positions of ∼10S ∼80/150S and ≥500S complexes are indicated. B) Amount of p55Gag associated with ABCE1 in fractions representing ∼80/150S and ≥500S complexes at indicated time-points was quantitated and graphed. All data are from one experiment and are representative of four independent experiments.
Figure 6:
Figure 6:. Standard EM and single immunogold labeling of Gag and ABCE1
COS-1 cells transfected with HIV (A,B) or mock plasmid (C) were processed for negative staining transmission EM (A) or for single immunogold labeling with αGag (B; 6-nm gold) or αABCE1 (C; 15-nm gold). In C, all ABCE1 labeling is indicated with arrows. Scale bars correspond to 100 nm. Plasma membrane (PM), cytoplasm (Cyt), nucleus (N) and nucleolus (n) are indicated.
Figure 7:
Figure 7:. Immunogold labeling of ABCE1 with wild-type Gag reveals colocalization
COS-1 cells expressing HIV were processed for immunogold double labeling with αGag (6-nm gold; indicated by white arrowheads) and αABCE1 (15-nm gold; indicated by black arrows). A) Low-power view showing plasma membrane (PM), cytoplasm (Cyt), nucleus (N) and nucleoli (n). B) Magnification of boxed area from A. C–E show high-power views from other fields. Asterisks in B and E show colocalization of Gag and ABCE1 in nearly completed capsids; asterisks in C and D show colocalization of Gag and ABCE1 in partially assembled capsids. Scale bars correspond to 200 nm.
Figure 9:
Figure 9:. Quantitation of Gag–ABCE1 colocalization at the plasma membrane
Sections of COS-1 cells expressing HIV or HIVΔNCΔp6 were analyzed for colocalization of Gag and ABCE1. Colocalization was defined as ABCE1 labeling within 100 nm of clusters of Gag labeling at the plasma membrane. A) Examples of negative (white arrow) and positive (black arrow) colocalization of Gag and ABCE1 are shown. Scale bar corresponds to 100 nm. B) Percentage of Gag clusters that were colocalized with ABCE1 was determined for cells expressing HIV versus HIVΔNCΔp6. Error bars show SEM from three experiments. A total of 64 micrographs of wild-type Gag and 44 micrographs of GagΔNCΔp6, each containing multiple Gag clusters, were counted.
Figure 8:
Figure 8:. Immunogold labeling of ABCE1 and Gag ΔNCΔp6 demonstrates that they do not colocalize
COS-1 cells expressing HIVΔNCΔp6 were processed for immunogold double labeling with αGag (6-nm gold; indicated by white arrowheads) and αABCE1 (15-nm gold; indicated by black arrows). A) Low-power view showing plasma membrane (PM) and cytoplasm (Cyt). B) Inset of boxed area in A. Scale bars correspond to 200 nm.

Similar articles

Cited by

References

    1. Briggs JA, Simon MN, Gross I, Krausslich HG, Fuller SD, Vogt VM, Johnson MC. The stoichiometry of Gag protein in HIV-1. Nat Struct Mol Biol. 2004;11:672–675. - PubMed
    1. Campbell S, Fisher RJ, Towler EM, Fox S, Issaq HJ, Wolfe T, Phillips LR, Rein A. Modulation of HIV-like particle assembly in vitro by inositol phosphates. Proc Natl Acad Sci USA. 2001;98:10875–10879. - PMC - PubMed
    1. Campbell S, Rein A. In vitro assembly properties of human immunodeficiency virus type 1 Gag protein lacking the p6 domain. J Virol. 1999;73:2270–2279. - PMC - PubMed
    1. Campbell S, Vogt VM. In vitro assembly of virus-like particles with Rous sarcoma virus Gag deletion mutants: identification of the p10 domain as a morphological determinant in the formation of spherical particles. J Virol. 1997;71:4425–4435. - PMC - PubMed
    1. Dooher JE, Lingappa JR. Conservation of a stepwise, energy-sensitive pathway involving HP68 for assembly of primate lentivirus capsids in cells. J Virol. 2004;78:1645–1656. - PMC - PubMed

Publication types

Substances