. 2007 Jan 17:7:11.
doi: 10.1186/1471-2407-7-11.

Metabolic mapping by use of high-resolution magic angle spinning 1H MR spectroscopy for assessment of apoptosis in cervical carcinomas

Affiliations

Metabolic mapping by use of high-resolution magic angle spinning 1H MR spectroscopy for assessment of apoptosis in cervical carcinomas

Heidi Lyng et al. BMC Cancer. .

Abstract

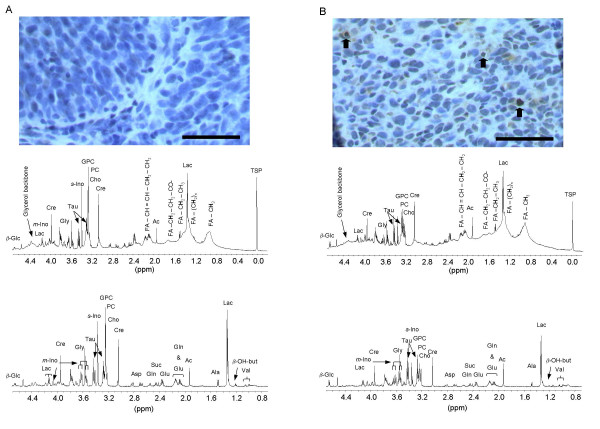
Background: High-resolution magic angle proton magnetic resonance spectroscopy (HR 1H MAS MRS) provides a broad metabolic mapping of intact tumor samples and allows for microscopy investigations of the samples after spectra acquisition. Experimental studies have suggested that the method can be used for detection of apoptosis, but this has not been investigated in a clinical setting so far. We have explored this hypothesis in cervical cancers by searching for metabolites associated with apoptosis that were not influenced by other histopathological parameters like tumor load and tumor cell density.

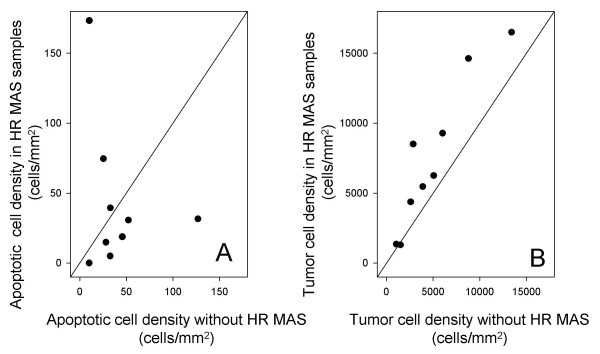
Methods: Biopsies (n = 44) taken before and during radiotherapy in 23 patients were subjected to HR MAS MRS. A standard pulse-acquire spectrum provided information about lipids, and a spin-echo spectrum enabled detection of non-lipid metabolites in the lipid region of the spectra. Apoptotic cell density, tumor cell fraction, and tumor cell density were determined by histopathological analysis after spectra acquisition.

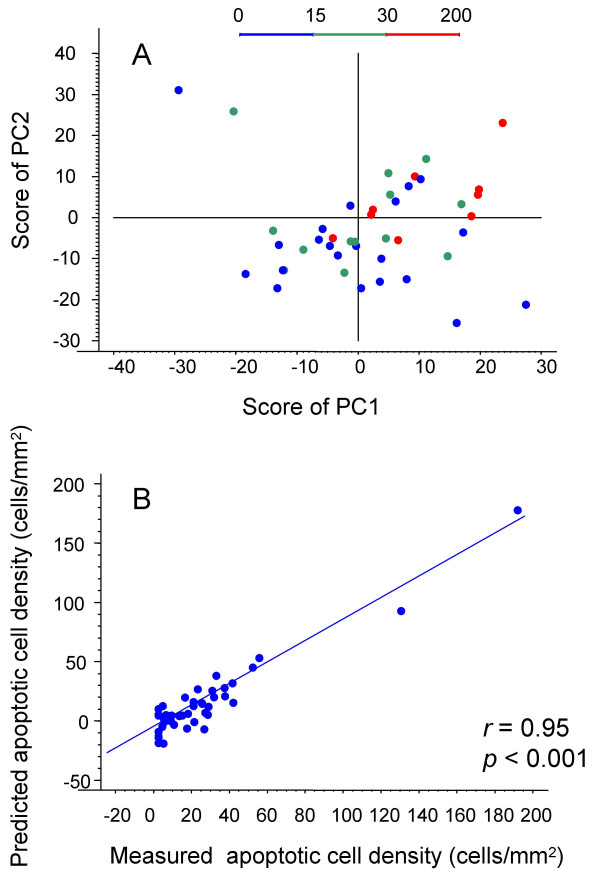
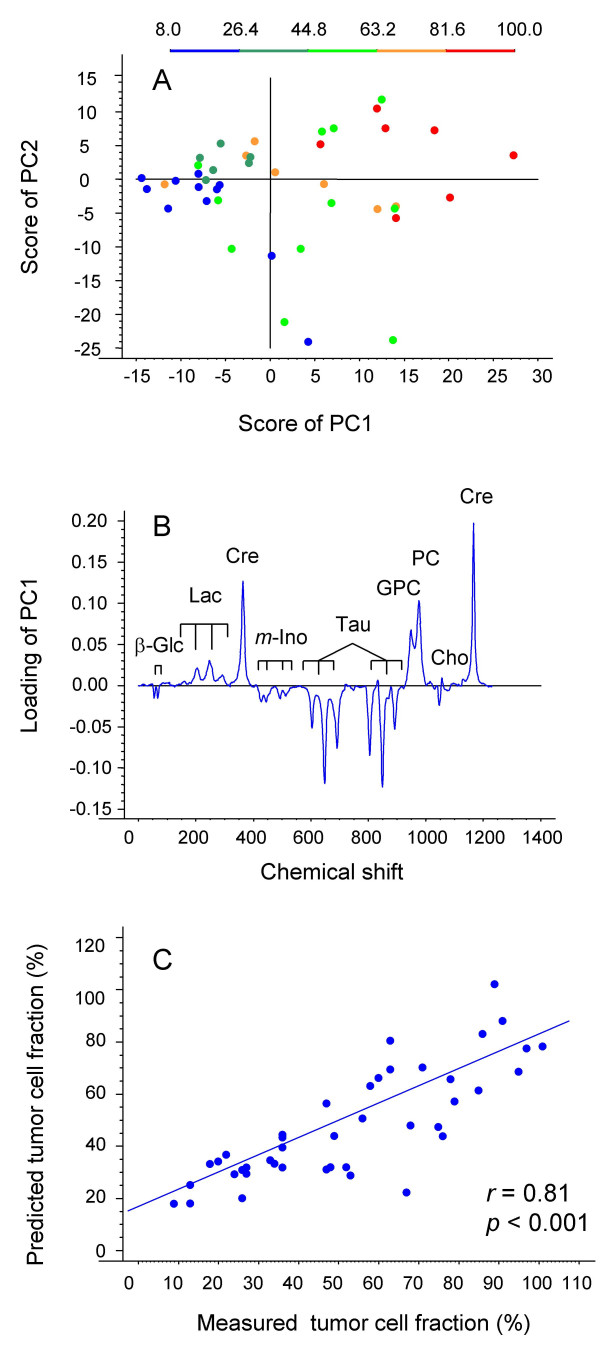
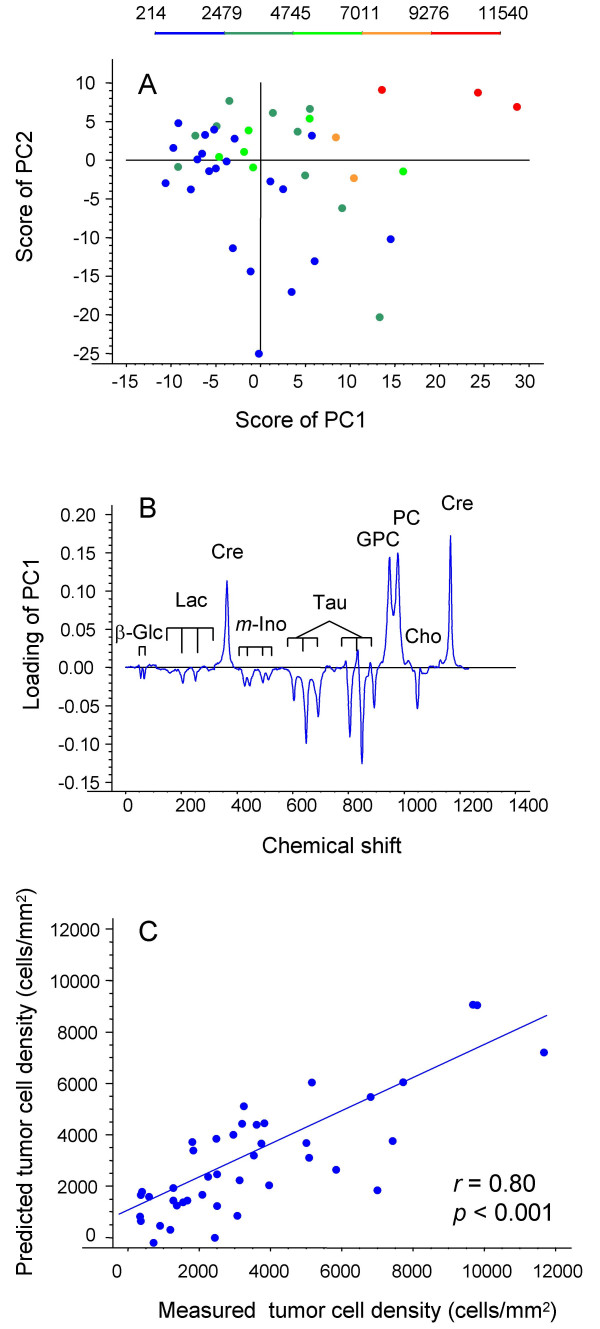
Results: The apoptotic cell density correlated with the standard pulse-acquire spectra (p < 0.001), but not with the spin-echo spectra, showing that the lipid metabolites were most important. The combined information of all lipids contributed to the correlation, with a major contribution from the ratio of fatty acid -CH2 to CH3 (p = 0.02). In contrast, the spin-echo spectra contained the main information on tumor cell fraction and tumor cell density (p < 0.001), for which cholines, creatine, taurine, glucose, and lactate were most important. Significant correlations were found between tumor cell fraction and glucose concentration (p = 0.001) and between tumor cell density and glycerophosphocholine (GPC) concentration (p = 0.024) and ratio of GPC to choline (p < 0.001).

Conclusion: Our findings indicate that the apoptotic activity of cervical cancers can be assessed from the lipid metabolites in HR MAS MR spectra and that the HR MAS data may reveal novel information on the metabolic changes characteristic of apoptosis. These changes differed from those associated with tumor load and tumor cell density, suggesting an application of the method to explore the role of apoptosis in the course of the disease.


Figures

Figure 1
Figure 1
Apoptotic cell density (A) and tumor cell density (B) in cervical cancer biopsies after HR MAS MR spectroscopy versus the corresponding data of samples from the same tumors but not subjected to MR spectroscopy. MR spectroscopy was performed at an instrumental setting of 4°C. The HR MAS samples were fixed in formalin after spectrum acquisition, using an average time period of 1 hour 55 min from the start of the experiment to fixation. Each point represents the data of a single biopsy. The values were calculated as number of apoptotic tumor cells (A) and tumor cells (B) per mm2 of tumor tissue. Lines of unity are shown. Note that there was no increase in apoptotic cell density or decrease in tumor cell density caused by the MR experiment. The increased tumor cell density (B) was probably due to a minor increase in the thickness of the histological sections from the HR MAS samples as compared to the others.
Figure 2
Figure 2
Histological section and HR MAS MR standard pulse-acquire spectrum (upper) and spin-echo spectrum (lower) of two cervical cancer biopsies, one with no apoptosis (A) and another with significant apoptotic activity (B). The histological sections were stained for apoptotic cells by use of the TUNEL method after spectrum acquisition. The biopsy presented in (A) had a tumor cell fraction of 85%, tumor cell density of 9552 cells/mm2, and no apoptosis, whereas the corresponding data of the biopsy in (B) were 35%, 3606 cells/mm2, and 8.3 apoptotic cells/mm2. Bars in the histological sections represent 50 μm, and arrows in (B) point to apoptotic cells. Note the highly preserved morphology of the samples after spectrum acquisition. Spectral assignments are abbreviated: β-Glc, β-glucose; Lac, lactate; m-Ino, myo-inositol; Cre, creatine; Gly, glycine; Tau, taurine; s-Ino, scyllo-inositol; GPC, glycerophosphocholine; PC, phosphocholine; Cho, choline; FA, fatty acids; TSP, trimethylsilyl propionic acid; Asp, aspartate; Gln, glutamine; Suc, succinate; Glu, glutamate; Ac, acetate; Ala, alanine; β-OH-but, β-hydroxybutyrate; Val, valine. The position of hydrogens in fatty acids giving rise to the different peaks is marked in bold after the notation FA in the upper spectra.
Figure 3
Figure 3
Score plot of first principal component (PC1) versus second principal component (PC2) from partial least square (PLS) regression calibration of apoptotic cell density to single-pulse spectral data (A), and the predicted versus measured apoptotic cell density (B). Each point represents the data of a single biopsy. In (A) the color code for apoptotic cell densities (cells/mm2) is shown. The Pearson correlation coefficient and p-value are marked in (B). Total residual y-variance and root mean square error of prediction were minimised by retaining 11 PCs in the model. These 11 PCs accounted for 98% of the total x-variation, and 92% of the total y-variation. An informative loading profile could not be generated due to the high number of principal components that were retained in the model.
Figure 4
Figure 4
Score plot of first principal component (PC1) versus second principal component (PC2) from partial least square (PLS) regression analysis of tumor cell fraction to spin-echo spectral data (A), the corresponding loading profile of PC1 (B), and the predicted versus measured tumor cell fraction (C). In (A) and (C) each point represents the data of a single biopsy. In (A) the color code for tumor cell fractions (%) is shown. Spectral assignments are abbreviated in (B): β-Glc, β-glucose; Lac, lactate; m-Ino, myo-inositol; Cre, creatine; Tau, taurine; GPC, glycerophosphocholine; PC, phosphocholine; Cho, choline. The Pearson correlation coefficient and p-value are marked in (C). Total residual y-variance and root mean square error of prediction were minimised by retaining 2 PCs in the model. These two PCs accounted for 45% of the total x-variation, and 66% of the total y-variation.
Figure 5
Figure 5
Score plot of first principal component (PC1) versus second principal component (PC2) from partial least square (PLS) regression analysis of tumor cell density to spin-echo spectral data (A), the corresponding loading profile of PC1 (B), and the predicted versus measured tumor cell density (C). In (A) and (C) each point represents the data of a single biopsy. In (A) the color code for tumor cell densities (cells/mm2) is shown. Spectral assignments are abbreviated in (B): β-Glc, β-glucose; Lac, lactate; m-Ino, myo-inositol; Cre, creatine; Tau, taurine; GPC, glycerophosphocholine; PC, phosphocholine; Cho, choline. The Pearson correlation coefficient and p-value are marked in (C). Total residual y-variance and root mean square error of prediction were minimised by retaining 3 PCs in the model. These three PCs accounted for 52% of the total x-variation, and 65% of the total y-variation.

References

    1. Lowe SW, Lin AW. Apoptosis in cancer. Carcinogenesis. 2000;21:485–495. doi: 10.1093/carcin/21.3.485. - DOI - PubMed
    1. Schmitt CA, Lowe SW. Apoptosis and therapy. J Pathol. 1999;187:127–137. doi: 10.1002/(SICI)1096-9896(199901)187:1<127::AID-PATH251>3.0.CO;2-T. - DOI - PubMed
    1. Okada H, Mak TW. Pathways of apoptotic and non-apoptotic death in tumour cells. Nat Rev Cancer. 2004;4:592–603. doi: 10.1038/nrc1412. - DOI - PubMed
    1. Hockel M, Schlenger K, Hockel S, Vaupel P. Hypoxic cervical cancers with low apoptotic index are highly aggressive. Cancer Res. 1999;59:4525–4528. - PubMed
    1. Imoto I, Tsuda H, Hirasawa A, Miura M, Sakamoto M, Hirohashi S, Inazawa J. Expression of cIAP1, a target for 11q22 amplification, correlates with resistance of cervical cancers to radiotherapy. Cancer Res. 2002;62:4860–4866. - PubMed

Publication types