. 2007 Jan 18:7:4.
doi: 10.1186/1471-2261-7-4.

A long-term "memory" of HIF induction in response to chronic mild decreased oxygen after oxygen normalization

Affiliations

A long-term "memory" of HIF induction in response to chronic mild decreased oxygen after oxygen normalization

Chandrashekhar D Kamat et al. BMC Cardiovasc Disord. .

Abstract

Background: Endothelial dysfunction (ED) is functionally characterized by decreased vasorelaxation, increased thrombosis, increased inflammation, and altered angiogenic potential, has been intimately associated with the progression and severity of cardiovascular disease. Patients with compromised cardiac function oftentimes have a state of chronic mild decreased oxygen at the level of the vasculature and organs, which has been shown to exacerbate ED. Hypoxia inducible factor (HIF) is a transcription factor complex shown to be the master regulator of the cellular response to decreased oxygen levels and many HIF target genes have been shown to be associated with ED.

Methods: Human endothelial and aortic smooth muscle cells were exposed either to A) normoxia (21% O2) for three weeks, or to B) mild decreased oxygen (15% O2) for three weeks to mimic blood oxygen levels in patients with heart failure, or to C) mild decreased oxygen for two weeks followed by one week of normoxia ("memory" treatment). Levels of HIF signaling genes (HIF-1alpha, HIF-2alpha, VEGF, BNIP3, GLUT-1, PAI-1 and iNOS) were measured both at the protein and mRNA levels.

Results: It was found that chronic exposure to mild decreased oxygen resulted in significantly increased HIF signaling. There was also a "memory" of HIF-1alpha and HIF target gene induction when oxygen levels were normalized for one week, and this "memory" could be interrupted by adding a small molecule HIF inhibitor to the last week of normalized oxygen. Finally, levels of ubiquitylated HIF-1alpha were reduced in response to chronic mild decreased oxygen and were not full restored after oxygen normalization.

Conclusion: These data suggest that HIF signaling may be contributing to the pathogenesis of endothelial dysfunction and that normalization of oxygen levels may not be enough to reduce vascular stress.


Figures

Figure 1
Figure 1
Treatment scheme for experiments in this work. Isolated microvascular endothelial cells mild decreased oxygen (15% O2) for three weeks (I) or to mild decreased oxygen for two weeks then to normoxia for one week ("memory" treatment – II).
Figure 2
Figure 2
Effect of chronic relative hypoxia on a marker of cell proliferation in HMEC-1 cells. HMEC-1 cells were exposed to normoxia (20% O2) or to various levels of relative hypoxia for 3 weeks followed by a one hour incubation with 5 μM CFDA-AM and fluorescence measurement as in methods. The data represent the mean +/- SEM of triplicate wells from 3 independent experiments. ** = P < 0.01 and *** = P < 0.001 using one-way ANOVA with a Neuman-Keuls multiple comparisons post-test.
Figure 3
Figure 3
Effect of oxygen normalization on HIF-1α, HIF-2α, Glut-1, BNIP3, PAI-1, iNOS and VEGF protein expression in human endothelial cells. Human microvascular endothelial cells were exposed as described in Figure 1. Western blots were performed against HIF-1α (A), HIF-2α (B), Glut-1 (C), BNIP3 (D), PAI-1 (E), iNOS (F) on cellular lysates and ELISA was performed against VEGF (G) on cellular supernatants. Graphs indicate the densitometric analysis relative to the respective normoxic protein expression (dashed line) with a representative blot for each protein above each graph. Acute hypoxia (2.5%02; 4 hours) ("AH") was used as a positive control for the induction of proteins. Data in graphs represent the mean +/- S.E.M. from three separate experiments with a total sample size of 4–6. Asterisk, P < 0.05; double asterisk, P < 0.01; triple asterisk, P < 0.001 as compared to cells incubated in normoxia for three weeks.
Figure 4
Figure 4
Effect of oxygen normalization on HIF target mRNA expression in human endothelial cells. Human microvascular endothelial cells were exposed as described in Figure 1. Total RNA was extracted and the amount of HIF-1α (A), VEGF (B), Glut-1 (C), and iNOS (D) transcripts were analyzed by quantitative real-time RT-PCR as described in Materials and Methods. In the graphs (bottom panels), all values are expressed relative to the HPRT gene expression for each condition. Acute hypoxia (2.5% 02; 4 hours- "AH") was used as a positive control for the induction of transcripts. Data in graphs represent the mean +/- S.E.M. from three separate experiments with a sample size of 3–5 with representative gels above each graph. Asterisk, P < 0.05; double asterisk, P < 0.01; triple asterisk, P < 0.001 as compared to cells incubated in three weeks of normoxia (21%02) (N) (dashed line).
Figure 5
Figure 5
Effect of oxygen normalization on expression of HIF-1α, HIF-2α, VEGF, and GLUT-1 protein expression in HUVECs and ASMCs. HUVECs (A-D) and human ASMCs (E-H) were exposed as described in Figure 1. Western blots were performed against HIF-1α (A and E), HIF-2α (B and F), GLUT-1 (D-H) on cellular lysates and ELISA was performed against VEGF (C and G) on cellular supernatants. Graphs indicate the densitometric analysis relative to the respective normoxic protein expression (dashed line) with a representative blot for each protein above each graph. Acute hypoxia (2.5% 02; 4 hours – "AH") was used as a positive control for the induction of each of the target protein. Data in graphs represent the mean +/- S.E.M. from three separate experiments with a total sample size of 4–6 and with representative gels above each graph. Asterisk, P < 0.05; double asterisk, P < 0.01; triple asterisk, P < 0.001 as compared to cells incubated in normoxia for three weeks.
Figure 6
Figure 6
Effect of adenoviral siRNA on HIF-1α protein (A) and cell proliferation (B) in HMEC-1 cells. Adenoviral vectors containing hairpin siRNAs against HIF-1α were created as in the methods. Panel A. HMEC-1 cells were infected with 50–100 PFU/cell adenovirus or 5 μM YC-1, exposed to 5% O2 for 48 hours then cell lysates made and HIF-1α protein expression assessed by Western blot. Representative bands for HIF-1α are shown. Panel B. HMEC-1 cells were infected with adenovirus or treated with 5 μM YC-1 every 3 days for 7 days and cell proliferation assessed using the CFDA-AM assay as in methods. The data represent the mean +/- SEM of triplicate wells from 3 independent experiments. *** = P < 0.001 using one-way ANOVA with a Neuman-Keuls multiple comparisons post-test.
Figure 7
Figure 7
Effect of various inhibitors and anti-oxidants on "memory" for HIF-1α, HIF-2α, Glut-1, BNIP3, PAI-1, iNOS and VEGF expression in human endothelial cells. HUVECs were exposed to two weeks of mild decreased oxygen followed by one weeks of normoxia (DN) in the presence or absence of 5 μM of the HIF inhibitor YC-1, or 62.5 μM α-lipoic acid (ALA), or 25–100 PFU/cell UCP2 adenovirus, or 10 μM apocynin (APO), or 10 μM oxypurinol (OXY) or to 1 mM L-NAME. Western blots were performed against HIF-1α (A), HIF-2α (B), BNIP3 (D), PAI-1 (E), iNOS (F) and GLUT-1 (G) on cellular lysates and ELISA was performed against VEGF (C) on cellular supernatants. Graphs for each Western blot indicate the densitometric analysis relative to the respective "memory" (DN) protein expression (dashed line). Data in graphs represent the mean +/- S.E.M. from three separate experiments with a total sample size of 4–6 and with representative gels above each graph. Double asterisk, P < 0.01; triple asterisk, P < 0.001 as compared to cells in "memory" (DN) treatment.
Figure 8
Figure 8
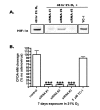
Effect of the transition from mild hypoxia to normoxia on the ubiquitylation of HIF-α. HUVECs were exposed to mild decreased oxygen as in Figure 1. Whole cell lysates were co-immunoprecipitated against HIF-1α and Western blot against ubiquitin (top panel) and HIF-1α (bottom panel) completed as in Materials and Methods. Densitometric analysis of ubiquitin expression in HUVECs graphed as a percentage of normoxic ubiquitin expression (dashed line). Data represent the mean +/- S.E.M. from three separate experiments with a total sample size of 4–6. Asterisk, P < 0.05; triple asterisk, P < 0.001 as compared to cells incubated in normoxia for three weeks.

Similar articles

Cited by

References

    1. Landmesser U, Hornig B, Drexler H. Endothelial function: a critical determinant in atherosclerosis? Circulation. 2004;109:II27–33. - PubMed
    1. Aronson D, Rayfield EJ, Chesebro JH. Mechanisms determining course and outcome of diabetic patients who have had acute myocardial infarction. Ann Intern Med. 1997;126:296–306. - PubMed
    1. Bugiardini R, Manfrini O, Pizzi C, Fontana F, Morgagni G. Endothelial function predicts future development of coronary artery disease: a study of women with chest pain and normal coronary angiograms. Circulation. 2004;109:2518–2523. doi: 10.1161/01.CIR.0000128208.22378.E3. - DOI - PubMed
    1. Britland ST, Young RJ, Sharma AK, Clarke BF. Relationship of endoneurial capillary abnormalities to type and severity of diabetic polyneuropathy. Diabetes. 1990;39:909–913. - PubMed
    1. Farhangkhoee H, Khan ZA, Kaur H, Xin X, Chen S, Chakrabarti S. Vascular endothelial dysfunction in diabetic cardiomyopathy: Pathogenesis and potential treatment targets. Pharmacol Ther. 2005 - PubMed

Publication types

MeSH terms

LinkOut - more resources