Comparative Study
. 2007 Jan 17;27(3):472-82.
doi: 10.1523/JNEUROSCI.2864-06.2007.

Goal-related activity in hippocampal place cells

Affiliations
Comparative Study

Goal-related activity in hippocampal place cells

Vincent Hok et al. J Neurosci. .

Abstract

Place cells are hippocampal neurons whose discharge is strongly related to a rat's location in its environment. The existence of place cells has led to the proposal that they are part of an integrated neural system dedicated to spatial navigation, an idea supported by the discovery of strong relationships between place cell activity and spatial problem solving. To further understand such relationships, we examined the discharge of place cells recorded while rats solved a place navigation task. We report that, in addition to having widely distributed firing fields, place cells also discharge selectively while the hungry rat waits in an unmarked goal location to release a food pellet. Such firing is not duplicated in other locations outside the main firing field even when the rat's behavior is constrained to be extremely similar to the behavior at the goal. We therefore propose that place cells provide both a geometric representation of the current environment and a reflection of the rat's expectancy that it is located correctly at the goal. This on-line feedback about a critical aspect of navigational performance is proposed to be signaled by the synchronous activity of the large fraction of place cells active at the goal. In combination with other (prefrontal) cells that provide coarse encoding of goal location, hippocampal place cells may therefore participate in a neural network allowing the rat to plan accurate trajectories in space.


Figures
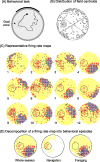
Figure 1.
Figure 1.
A, Sketch of the place preference task. The rat must enter an unmarked goal zone to release a food pellet from an overhead feeder. To find and eat a food pellet, the rat has to forage around the cylinder. The black dot shows the start of a navigational path originating perhaps at the location where a previously released food pellet was found. The solid line shows the path taken to the goal zone (black circle) where the rat must stay for 2 s to release a pellet. The dashed line shows the foraging path taken after pellet release; it ends at the white dot where the rat finds the pellet. B, Distribution of the centroids of place cell firing fields in the cylinder. The goal zone is shown as a gray disk. C, Firing rate maps for 12 example place cells with putative excess discharge in the goal zone. Each firing rate map was generated using data from the entire recording session. In all maps, yellow indicates no firing and purple indicates maximum firing (orange, red, green, and blue indicate intermediate firing rates from low to high). Median firing rates for purple pixels and mean spike amplitudes are as follows: cell 1, 10.3 AP/s (196 μV); cell 2, 16.3 AP/s (154 μV); cell 3, 6.0 AP/s (242 μV); cell 4, 12.8 AP/s (162 μV); cell 5, 13.3 AP/s (242 μV); cell 6, 14.7 AP/s (185 μV); cell 7, 39.1 AP/s (546 μV); cell 8, 20.4 AP/s (569 μV); cell 9, 22.5 AP/s (150 μV); cell 10, 30.3 AP/s (162 μV); cell 11, 13.7 AP/s (173 μV); cell 12, 21.9 AP/s (212 μV). D, Firing rate map for an entire session of a place cell (left) separated into navigation episodes (middle) and foraging episodes (right). Navigation maps for a session were based on accumulated 4 s intervals from before pellet release; these included 2 s of navigation to the zone and 2 s in the zone. Foraging maps were constructed from remaining data samples of the same session. Median firing rates for purple pixels were 12.8 AP/s.
Figure 2.
Figure 2.
Characterization of the spatial and temporal activity of an exemplar place cell. A, Firing rate map. The main firing field occupied an arc of ∼70° from 3:30 to 5:30 o'clock. There was also a distinct, secondary firing region at the goal. B, Raster plot. Each row shows 16 s of data for a “trial” and is aligned to the release of a food pellet at t = 2 s. Each trial starts 10 s before entry into the goal zone, continues for the 2 s goal period and then for 4 s after food release. The tick marks along a row indicate the time of an action potential. The vertical lines (continued in C) show the 2 s goal period. The intense activity bursts in some pregoal periods occur because the rat happens to navigate toward the goal zone on a path that goes through the main firing field. C, Perievent histogram. The timescale is the same as for the raster plot. Action potential activity is accumulated across trials in 200 ms bins. The activity peak in the range from −7 to −3 s reflects the tendency of this rat to go through the main firing field of the cell with the indicated lag before entering the goal zone.
Figure 3.
Figure 3.
Temporal activity of 15 example place cells. Raster plots and PETHs for 15 place cells. In raster plots, each row summarizes a successful pause in the goal zone trial; small ticks indicate the time of an action potential. The left vertical line is the time when the rat entered the goal zone and the right vertical line shows the end of the 2 s release period. Perievent histograms show activity accumulated across trials on the same timescale as the corresponding raster plot. Although none of the firing fields of the 15 place cells was in the goal zone, most showed a marked increase of discharge during the goal period. Increases outside the 2 s goal period could have several causes. Usually, such increases occur because the rat traversed the main firing field of the cell on some trials before or after a correct visit to the goal. For example, the raster plot of cell J suggests field traversals after correct responses for previous trials but before correct responses in the final trials of the session. Some cells also responded to the auditory stimulus associated with activation of the food dispenser at t = 2 s (e.g., cell M).
Figure 4.
Figure 4.
Characteristics of population activity during the goal period. A, Cumulative PETH for all place cells recorded from rats tested in the place task (n = 152). The 2 s goal period (0–2 s) is bracketed by vertical lines (200 ms bins). The activity of each cell was normalized before summation was done over the sample. Note that the mean peak activity is delayed ∼1 s into the goal period. B, Percentage of cells whose activity showed the greatest increase at different times during the goal period of the place task. Entry into the goal zone is at t = 0 s. The delay suggested in the average of the cumulative PETH is seen here as a sharp rise near the middle of the goal period.
Figure 5.
Figure 5.
A, Cumulative normalized PETH for all place cells in the cue task (n = 87). The 2 s goal period (0–2 s) is bracketed by vertical lines (200 ms bins). In contrast to the delayed peak for the hidden goal place task, the histogram for the visible goal cue task shows a peak just after the rat's entry into the goal zone. B, Percentage of cells increasing their activity at different times during the goal period of the cue task. The profile is in great contrast to the equivalent for the hidden goal task shown in Figure 4B. C, Comparison of speed profiles in the hidden and visible goal tasks at 0.5 s resolution starting 1 s before the goal period and continuing to its end. Goal zone entry is at t = 0 s. Several behavioral features are visible including a marked slowing of running speed just after goal zone entry, quite similar speeds in the first and second halves of the goal period, and a near identity of the profiles for the two tasks. Error bars indicate SEM.
Figure 6.
Figure 6.
A cross-correlogram showing the number of coincident spikes between two cells during the 2000 ms goal period. The correlogram was made using sliding windows (300 ms with a time shift of 150 ms; bin width, 5 ms). The time lag between spikes in the two cells is plotted on the y-axis, and the magnitude of spike coincidence is shown as indicated by the color scale on the right. An increase in synchronized discharges was observed ∼1000–1200 ms after the rat entered the goal zone.
Figure 7.
Figure 7.
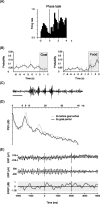
A, Cumulative normalized PETH for all place cells (n = 27) recorded from the second batch of rats tested in the place task. The 2 s goal period (0–2 s) is bracketed by vertical lines (200 ms bins). The histogram shows a peak at the middle of the goal period and has the same appearance as the first place cell sample (Fig. 4A). B, Left, Relative distribution of the occurrence of SWRs before and during the goal period. Rat's entry in the goal zone is at t = 0. The overall mean occurrence rate of SWRs was low (0.23 s−1), and there was a tendency for ripples to occur at an even lower rate during the 2 s goal period (shown on gray background). Right, Relative distribution of SWRs before and after food finding; there is a clear increase in the occurrence of SWRs after food finding. Food finding is at t = 0. C, Filtered hippocampal EEG showing SWRs after food finding; such striking events would have been easily detected during goal waiting periods. Calibration, 200 ms. D, Representative examples of the PSD during the 2 s period preceding arrival to the goal zone before a correct response (black line) and during the subsequent 2 s goal period (gray line). The PSDs reveal the existence of a peak in the theta band during both epochs. A downward shift of peak power frequency was observed during the goal periods of all recorded sessions, suggesting a switch from type I to type II theta. E, Dynamic analysis of changes in theta activity. In this representative example, the top trace is the average unfiltered EEG during one session made up of 32 trials. The middle trace shows average filtered EEG (4–12 Hz). The bottom trace shows the time course of event-related power perturbations. Shaded areas show nonsignificant values (p > 0.01).
Figure 8.
Figure 8.
Temporal activity of five example interneurons. Raster plots and PETHs for these putative interneurons are shown in the same way as the place cells in Figures 2 and 3. The 2 s goal period (0–2 s) is bracketed by vertical lines (200 ms bins). Although all interneurons showed marked variations in discharge during the goal period, no consistent across-cell pattern emerged. Cells were seen whose discharge decreased (e.g., cells A and B), increased (e.g., cell C), or had more complicated, multiphasic patterns of change during the goal period (e.g., cells D and E).

Similar articles

Cited by

References

    1. Brown EN, Frank LM, Tang D, Quirk MC, Wilson MA. A statistical paradigm for neural spike train decoding applied to position prediction from ensemble firing patterns of rat hippocampal place cells. J Neurosci. 1998;18:7411–7425. - PMC - PubMed
    1. Buzsáki G. Hippocampal sharp waves: their origin and significance. Brain Res. 1986;398:242–252. - PubMed
    1. Deadwyler SA, Bunn T, Hampson RE. Hippocampal ensemble activity during spatial delayed-non-match-to-sample performance in rats. J Neurosci. 1996;16:354–372. - PMC - PubMed
    1. Delorme A, Makeig S. EEGLAB: an open source toolbox for analysis of single-trial EEG dynamics including independent component analysis. J Neurosci Methods. 2004;134:9–21. - PubMed
    1. Fenton AA, Csizmadia G, Muller RU. Conjoint control of hippocampal place cell firing by two visual stimuli. I. The effects of moving the stimuli on firing field positions. J Gen Physiol. 2000;116:191–209. - PMC - PubMed

Publication types