Comparative Study
. 2007 Jan 17;27(3):590-603.
doi: 10.1523/JNEUROSCI.4302-06.2007.

Ankyrin-dependent and -independent mechanisms orchestrate axonal compartmentalization of L1 family members neurofascin and L1/neuron-glia cell adhesion molecule

Affiliations
Comparative Study

Ankyrin-dependent and -independent mechanisms orchestrate axonal compartmentalization of L1 family members neurofascin and L1/neuron-glia cell adhesion molecule

Tatiana Boiko et al. J Neurosci. .

Abstract

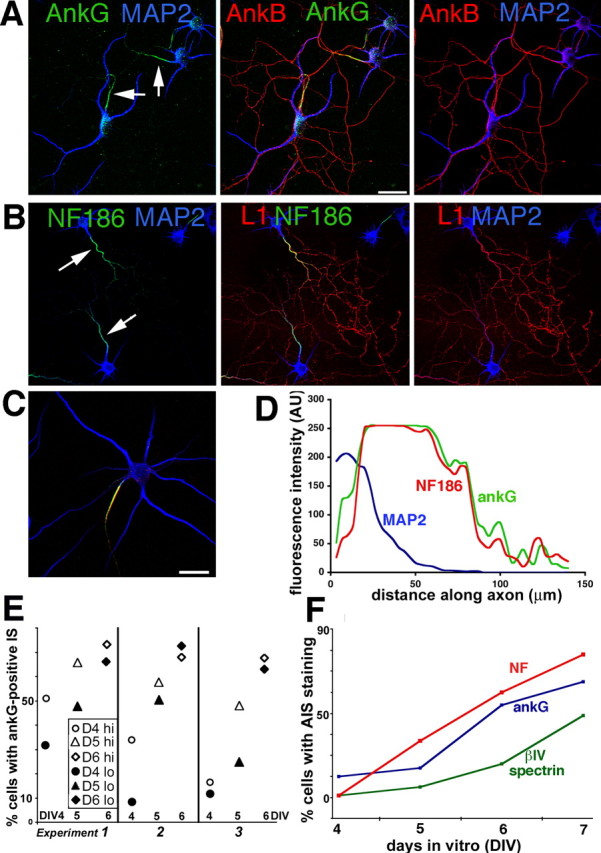
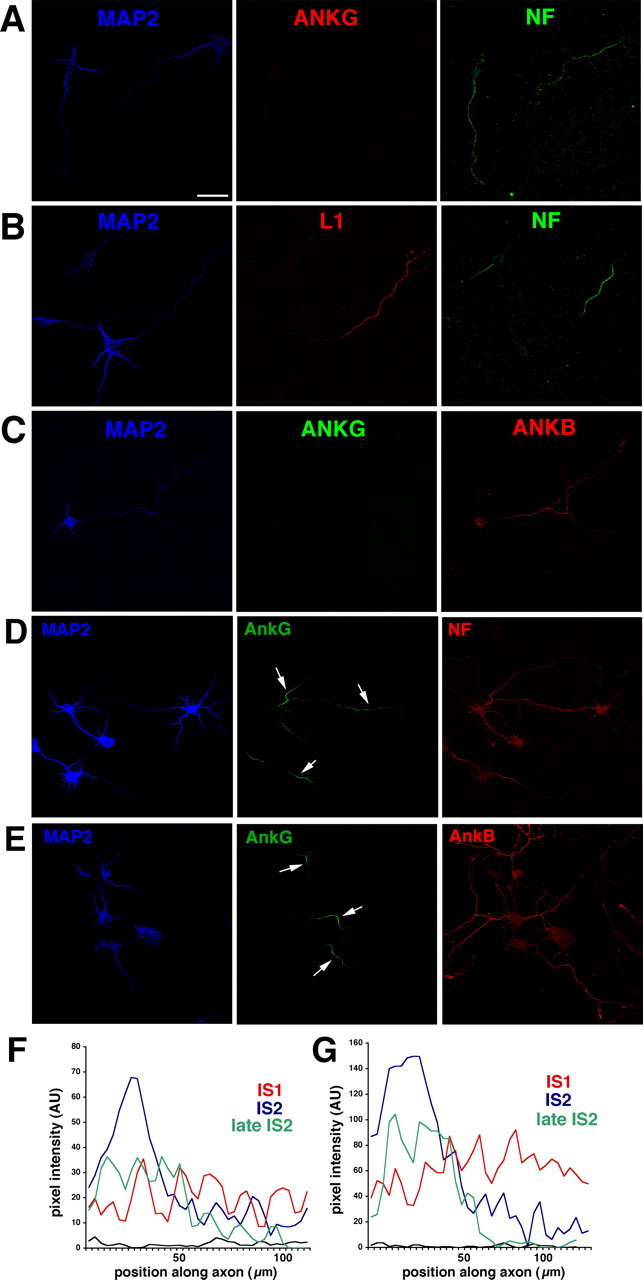
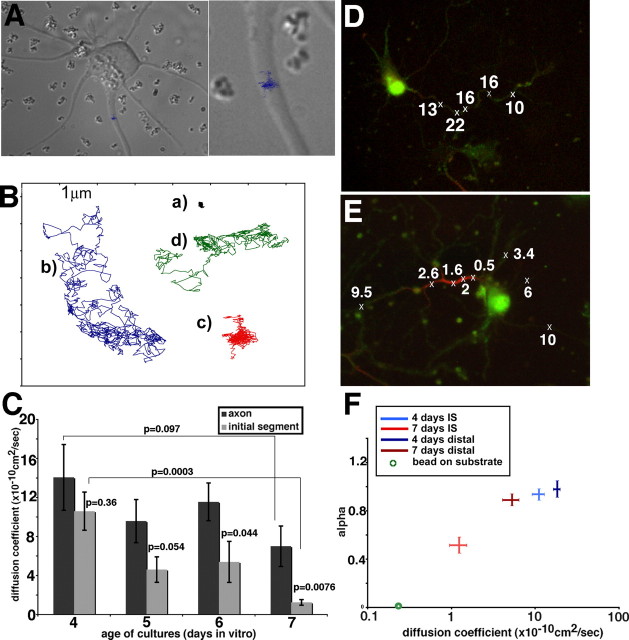
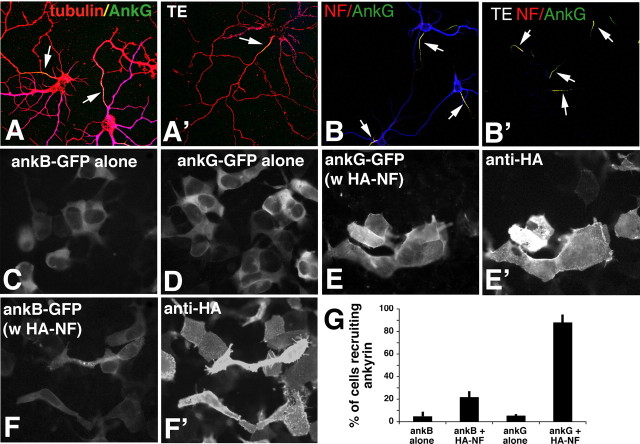
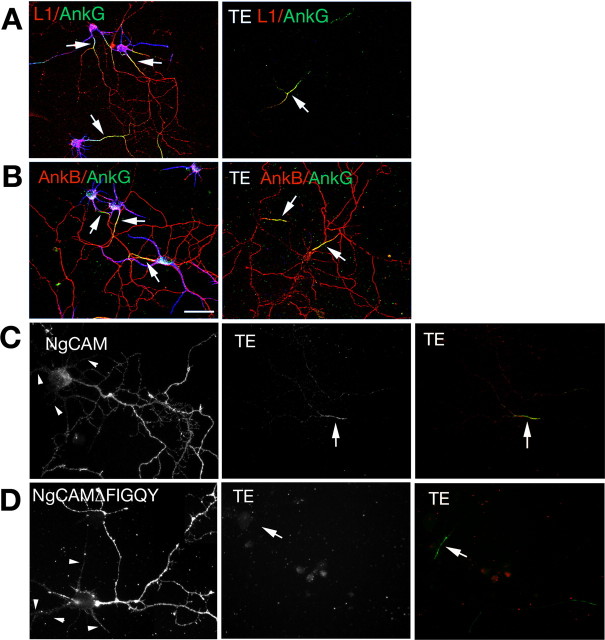
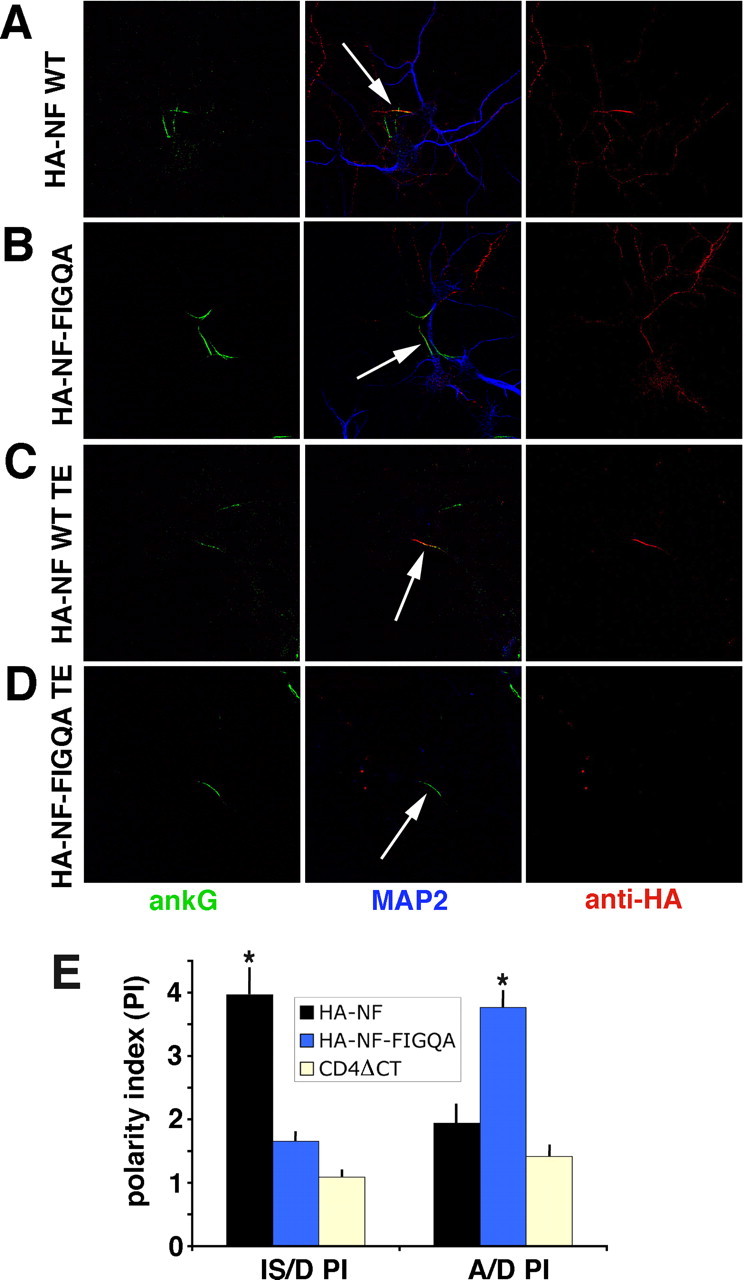
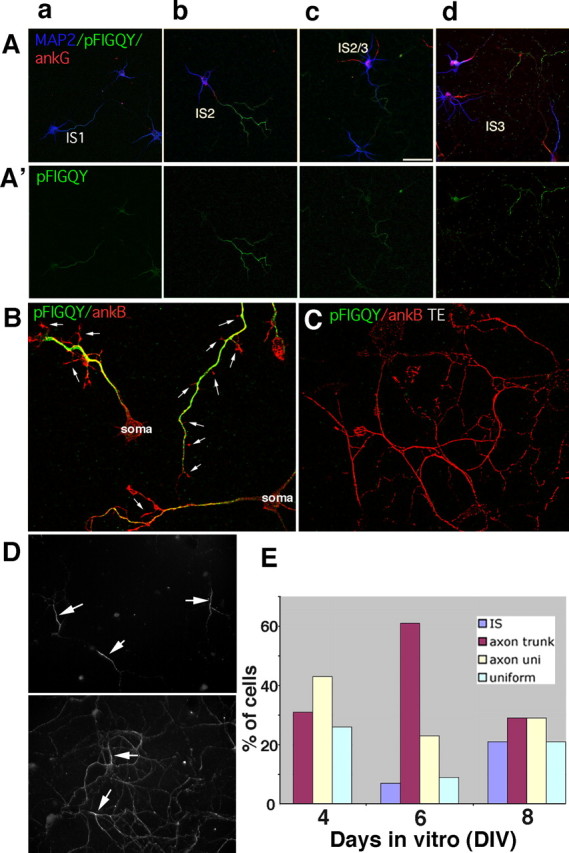
Axonal initial segments (IS) and nodes of Ranvier are functionally important membrane subdomains in which the clustering of electrogenic channels enables action potential initiation and propagation. In addition, the initial segment contributes to neuronal polarity by serving as a diffusion barrier. To study the mechanisms of axonal compartmentalization, we focused on two L1 family of cell adhesion molecules (L1-CAMs) [L1/neuron-glia cell adhesion molecule (L1/NgCAM) and neurofascin (NF)] and two neuronal ankyrins (ankB and ankG). NF and ankG accumulate specifically at the initial segment, whereas L1/NgCAM and ankB are expressed along the entire lengths of axons. We find that L1/NgCAM and NF show distinct modes of steady-state accumulation during axon outgrowth in cultured hippocampal neurons. Despite their different steady-state localizations, both L1/NgCAM and NF show slow diffusion and low detergent extractability specifically in the initial segment but fast diffusion and high detergent extractability in the distal axon. We propose that L1-CAMs do not strongly bind ankB in the distal axon because of spatial regulation of ankyrin affinity by phosphorylation. NF, conversely, is initially enriched in an ankyrin-independent manner in the axon generally and accumulates progressively in the initial segment attributable to preferential binding to ankG. Our results suggest that NF and L1/NgCAM accumulate in the axon by an ankyrin-independent pathway, but retention at the IS requires ankyrin binding.


Figures

Figure 1.
Figure 1.
Differential distribution of L1 family members and ankyrins in cultured hippocampal neurons. A, B, Hippocampal neurons cultured in vitro for 10–12 d (DIV) were stained with antibodies against the L1 family members L1 (red) and neurofascin (green) (B) and against ankyrinG (green) and ankyrin B (red) (A). MAP2 was counterstained in blue to indicate the location of soma and dendrites. ankB and L1 are found enriched along axons, whereas ankG and NF are found enriched on the axonal IS (see arrows). C, D, The staining intensity of cells triple stained with antibodies against MAP2 (blue), NF (red), and ankG (green) were analyzed by line intensity scans using NIH ImageJ software. A typical cell is shown. Tracings were started at the soma/hillock boundary and extended for 80–100 μm along the axon. The intensity of NF (red profile) and ankG (green profile) closely align along axons of stage 4 neurons. The IS, as delineated by ankG and NF staining, measures ∼60 μm. MAP2 (blue profile) staining, in contrast, falls off sharply at the axon hillock. Scale bars, 50 μm. E, Density of neuronal cultures influences the time course of ankG accumulation at the IS. Cultures were plated in 60 mm dishes containing several coverslips at two different densities [hi, 200,000 cells per 60 mm dish (open symbols); lo, 100,000 cells per 60 mm dish (filled symbols)], and one coverslip was removed from the same dish at consecutive days (DIV4, circles; DIV5, triangles; DIV6, diamonds) and stained against ankG. The results are shown for three independent cultures. Despite variability, the low-density (filled symbols) cultures showed slower maturation of the IS in each experiment than the higher-density cultures (open symbols). F, Coverslips were fixed at consecutive days from the same culture and stained against NF (red), ankG (blue), and βIV-spectrin (green). The percentage of cells showing IS enrichment is shown for one such experiment.
Figure 2.
Figure 2.
Expression of L1 family members and ankyrins during axonogenesis. A–C, Localization of L1 family members and ankyrins in early stage 3 neurons before detectable ankG accumulation at the IS (equivalent to IS1 stage). Early stage 3 neurons were stained with antibodies against MAP2 (blue), ankG (red), and NF (green) (A), against MAP2 (blue), L1 (red), and NF (green) (B), and against MAP2 (blue), ankG (green), and ankB (red) (C). MAP2 staining in IS1 cells is bright in the somatodendritic domain but is still detectable a significant distance into the axon. ankG is not detectable in the IS. NF, L1, and ankB are all found axonally enriched. NF staining extends past the initial segment. IS1 can therefore be classified based on MAP2 and NF staining or on MAP2 and ankG staining. D–G, Localization of L1 family members and ankyrins in late stage 3 neurons after ankG becomes IS-enriched (equivalent to stage IS2). D, Late stage 3 neurons were stained against MAP2 (blue), ankG (green), and NF (red). E, Late stage 3 neurons were stained against MAP2 (blue), ankG (green), and ankB (red). Arrows point at the IS. Scale bar, 50 μm. F, G, Intensity line scans from three DIV4 cells stained against NF (F) and ankG (G). Scans from cells classified as IS1 (red), IS2 (blue), and late IS2 (green) by their ankG patterns were plotted in the same graph for comparison. The intensity of staining increases at the IS and ultimately sharpens into a wide plateau with sharp rise and fall transitions at the borders. At the same time, the staining in the distal axon diminishes. All images were photographed and processed identically. The black line shows the level of nonspecific background staining.
Figure 3.
Figure 3.
Low diffusibility of NF correlates in time and space with ankG expression in the IS. A, A cultured neuron used for single-particle tracking with anti-NF-coated beads. The trajectory traversed by one bead over a 30 s time course (900 video frames) is superimposed on the differential interference contrast image of the cell. This bead was placed on the IS and did not diffuse far along the axon but stayed in a confined area. The right is a close-up. B, Examples of bead trajectories obtained with anti-NF-coupled beads. a, Stationary bead; b, freely diffusing bead; c, confined bead; d, combination of short confinement phases and free diffusion. C, Diffusion coefficients (D2–D4) were calculated from mean square displacement plots for anti-NF-coupled beads measured on cultured neurons of days 4–7. The diffusion coefficients were determined for beads initially placed on the IS (gray bars) or the distal axon (black bars). D2–D4 indicates essentially unrestricted diffusion for beads on DIV4 regardless of location. At later ages, beads placed on the distal axon diffused more rapidly than beads placed on the IS. Error bars indicate SEM. p values were calculated between pairs as indicated by the brackets. D, E, Bead diffusion was measured on DIV6 neurons. Subsequently, cells were fixed and stained with an antibody against ankG (red). The original cells were relocated, and bead position and behavior were compared with ankG staining. Crosses indicate position of beads placed. Numbers indicate D2–D4 (× 10−10 cm2/s). Beads overlying the ankG-positive segment (red) diffused more slowly than beads overlying the ankG-negative axon segments. F, The diffusion mode of beads was analyzed by determining α in curve fit analysis of the MSD plots for each bead. A linear MSD plot results in an α of 1, indicative of free Brownian diffusion. α values of less than one are indicative of confined diffusion mode. The diffusion coefficients D2–D4 are plotted on the x-axis, and α is plotted on the y-axis. The intersection of the lines corresponds to the average value for each condition, whereas the lengths of the arms of each cross indicate the SEM. The averages and SEM are shown for beads at DIV4 placed on the IS (light blue), DIV4 on the distal axon (dark blue), DIV7 on the IS (red), DIV7 on the distal axon (brown), and beads immobile on the substrate (green circle).
Figure 4.
Figure 4.
NF and ankG are detergent resistant in the IS and preferentially bind to each other in HEK 293 cells. A, B, Live detergent extractions of neurons. A, Neurons were either fixed directly (A, B) or extracted live in Triton-X100 (A′, B′; TE) before fixation and then stained against MAP2 (blue), tubulin (red), and ankG (green) (A, A′), or against MAP2 (blue), NF (red), and ankG (green) (B, B′). AnkG and NF are retained at the IS (arrows). C–G, Ankyrin recruitment assays in HEK 293 cells. HEK 293 cells were transfected with ankB-GFP alone (C), with ankG-GFP alone (D), with ankG-GFP plus HA–NF (E, E′), or with ankB–GFP plus HA–NF (F, F′). Ankyrin distribution was visualized in the green channel (C–F), whereas HA–NF was detected with an anti-HA antibody (E′, F′). G, Quantification of three independent experiments at equivalent ankyrin expression levels. The percentage of cells showing ankyrin recruitment is plotted on the y-axis for various combinations of expressed proteins as indicated on the x-axis. Error bars show the SDs.
Figure 5.
Figure 5.
The FIGQY motif is required for IS detergent resistance of L1/NgCAM. A, B, Localization of L1 (red in A), ankG (green), and ankB (red in B) in non-extracted control neurons (left) and after Triton X-100 extraction (TE) (right). MAP2 staining is in blue. IS are indicated by arrows. Scale bar, 50 μm. C, D, Localization of NgCAM (C) and NgCAMΔFIGQY (D) in nonextracted control neurons (left) and Triton X-100-extracted (TE) neurons (middle). Anti-NgCAM staining (red) is overlaid over ankG (green) in the right panels to indicate position of ankG-positive IS (arrows). Dendrites are indicated with arrowheads.
Figure 6.
Figure 6.
Mutation of the FIGQY motif of NF impairs IS localization and retention. AD, NF–HA (A, C) or HA–NF FIGQA (B, D) were expressed in hippocampal neurons and either fixed directly (A, B) or fixed after live Triton X-100 extraction (TE; C, D). Anti-HA staining is visualized in red, ankG staining in green, and MAP2 staining in blue. Single red channel images (right), single green channels (left), as well as merged images (middle) are shown for easier comparison. Arrows indicate IS. E, The A/D PI and IS/D PI were calculated by dividing the average fluorescence intensity along stretches of distal axon or IS by the average fluorescence intensity along stretches of dendrites. Dendrites were identified by MAP2 immunoreactivity, and IS was identified by ankG immunoreactivity. All transfected cells were scored regardless of expression levels. The average polarity indices for wild-type (WT) HA–NF (black bars; n = 29 cells), HA–NF FIGQA (blue bars; n = 58 cells), and CD4ΔCT (yellow bars; n = 34 cells) are plotted. Error bars indicate the SEM. *p < 0.001, statistically significant difference from CD4ΔCT by Mann–Whitney U test ().
Figure 7.
Figure 7.
Temporal and spatial regulation of the phospho-FIGQY epitope during maturation of hippocampal neurons. A, A′, phospho-FIGQY (green) staining patterns in hippocampal neurons at stages IS1 (a), IS2 (b), late IS2 (c), and IS3 (d). Neurons were stained simultaneously with antibodies against ankG (red) and MAP2 (blue). A′ shows green channels only. Scale bar, 50 μm. Quantification of the prevalence of different phospho-FIGQY staining patterns for a typical experiment is shown in E. B, C, Non-extracted (B) or Triton X-100-extracted (TE; C) neurons were stained against phospho-FIGQY (green) and ankB (red). Phospho-FIGQY staining (green) was essentially absent from filopodia and growth cones (arrows; B) and was detergent soluble (C). D, DIV7 (top) and DIV11 (bottom) neurons were Triton X-100-extracted and stained against L1. L1 is preferentially detergent resistant at the IS in DIV7 (top) but becomes increasingly non-extractable along the whole axon in DIV11 neurons (bottom).

References

    1. Ango F, di Cristo G, Higashiyama H, Bennett V, Wu P, Huang ZJ. Ankyrin-based subcellular gradient of neurofascin, an immunoglobulin family protein, directs GABAergic innervation at purkinje axon initial segment. Cell. 2004;119:257–272. - PubMed
    1. Beck KA, Nelson WJ. A spectrin membrane skeleton of the Golgi complex. Biochem Biophys Acta. 1998;14:153–160. - PubMed
    1. Bennett V, Chen L. Ankyrins and cellular targeting of diverse membrane proteins to physiological sites. Curr Opin Cell Biol. 2001;13:61–67. - PubMed
    1. Bennett V, Lambert S. Physiological roles of axonal ankyrins in survival of premyelinated axons and localization of voltage-gated sodium channels. J Neurocytol. 1999;28:303–318. - PubMed
    1. Berghs S, Aggujaro D, Dirkx RJ, Maksimova E, Stabach P, Hermel JM, Zhang JP, Philbrick W, Slepnev V, Ort T, Solimena M. betaIV spectrin, a new spectrin localized at axon initial segments and nodes of ranvier in the central and peripheral nervous system. J Cell Biol. 2000;151:985–1002. - PMC - PubMed

Publication types

MeSH terms

LinkOut - more resources