Comparative Study
. 2007 Jan 17;27(3):616-26.
doi: 10.1523/JNEUROSCI.4464-06.2007.

Deficiency in Na,K-ATPase alpha isoform genes alters spatial learning, motor activity, and anxiety in mice

Affiliations
Comparative Study

Deficiency in Na,K-ATPase alpha isoform genes alters spatial learning, motor activity, and anxiety in mice

Amy E Moseley et al. J Neurosci. .

Abstract

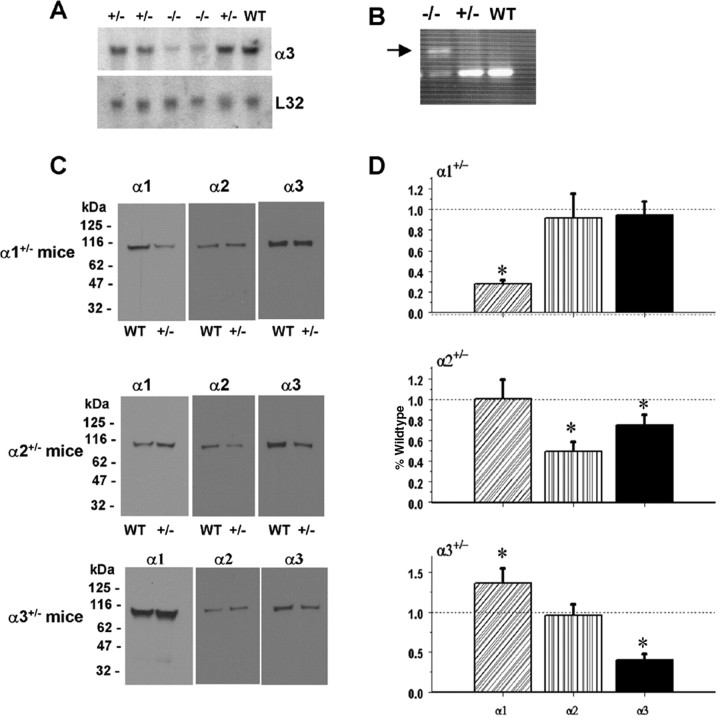
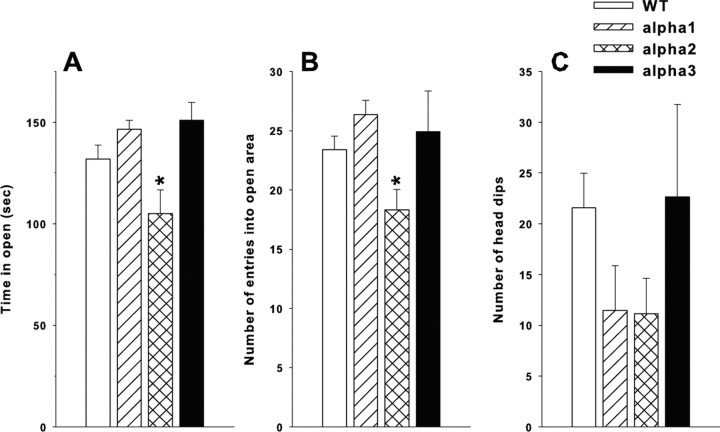
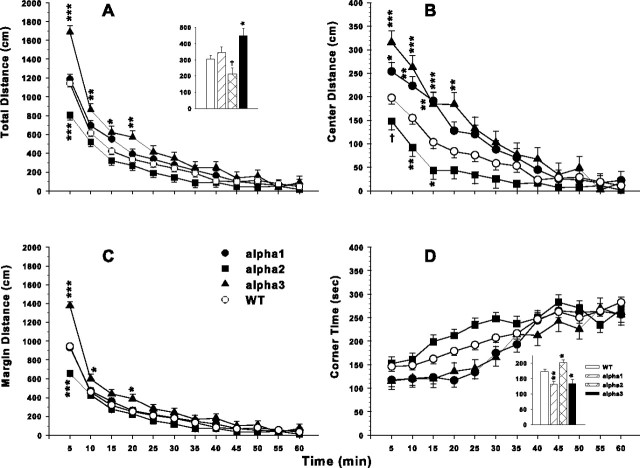
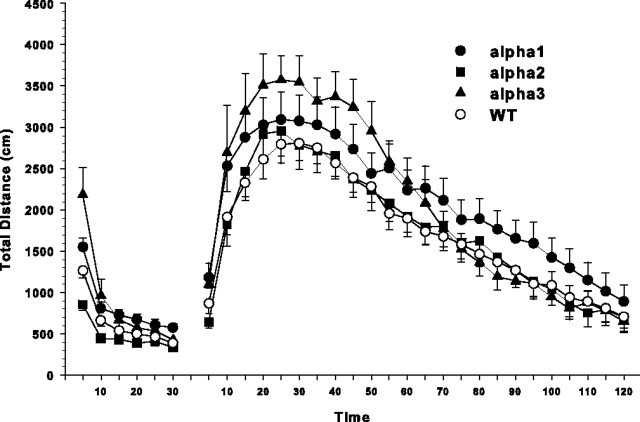
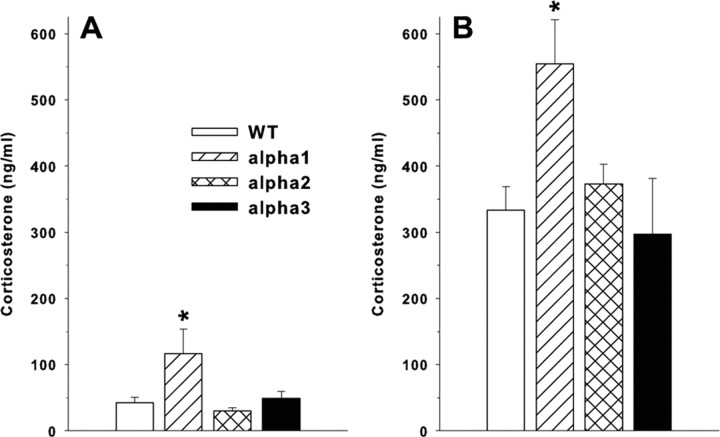
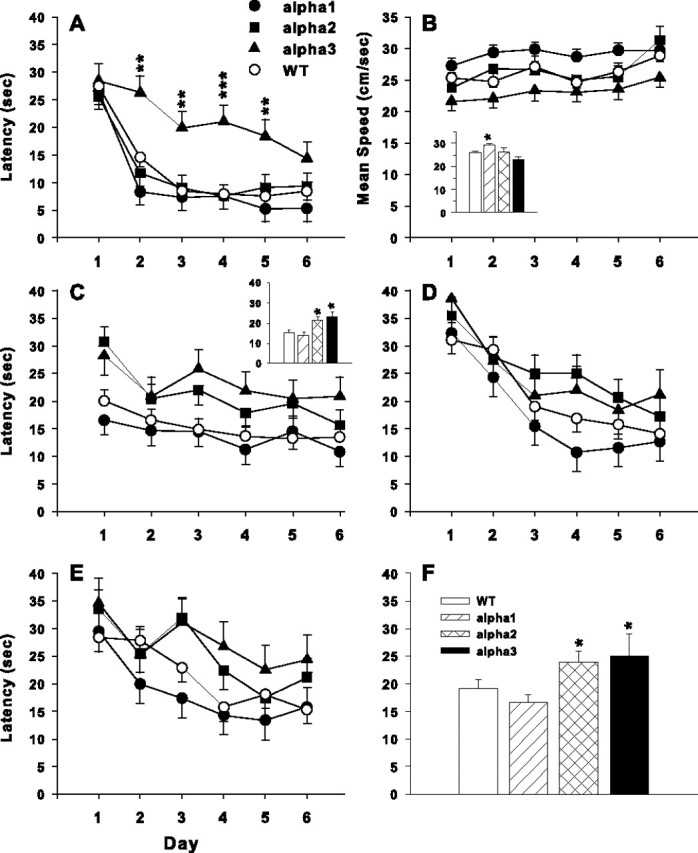
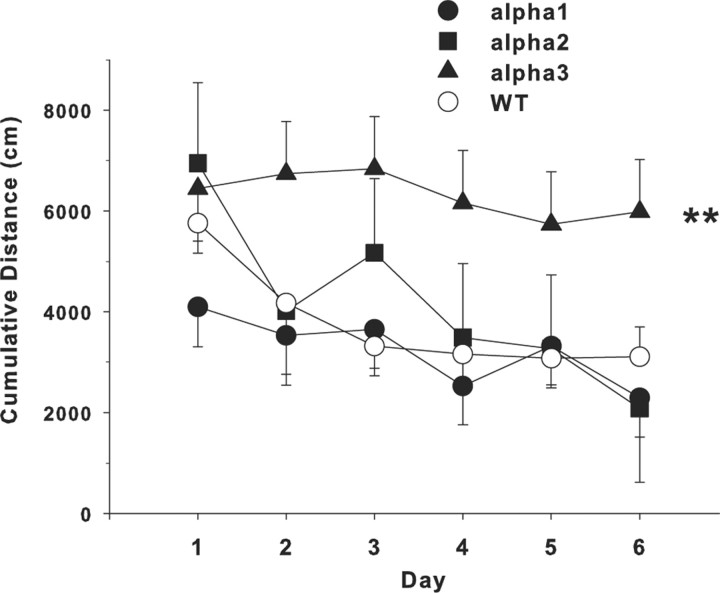
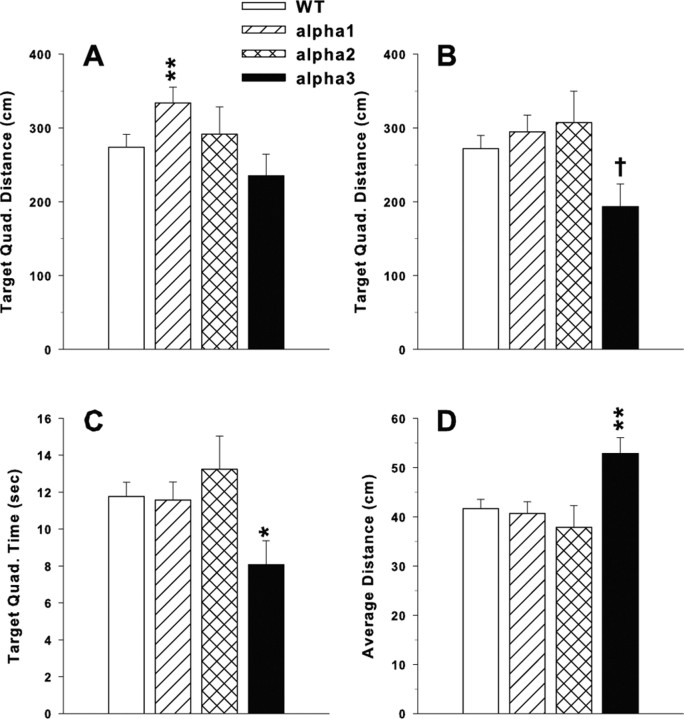
Several disorders have been associated with mutations in Na,K-ATPase alpha isoforms (rapid-onset dystonia parkinsonism, familial hemiplegic migraine type-2), as well as reduction in Na,K-ATPase content (depression and Alzheimer's disease), thereby raising the issue of whether haploinsufficiency or altered enzymatic function contribute to disease etiology. Three isoforms are expressed in the brain: the alpha1 isoform is found in many cell types, the alpha2 isoform is predominantly expressed in astrocytes, and the alpha3 isoform is exclusively expressed in neurons. Here we show that mice heterozygous for the alpha2 isoform display increased anxiety-related behavior, reduced locomotor activity, and impaired spatial learning in the Morris water maze. Mice heterozygous for the alpha3 isoform displayed spatial learning and memory deficits unrelated to differences in cued learning in the Morris maze, increased locomotor activity, an increased locomotor response to methamphetamine, and a 40% reduction in hippocampal NMDA receptor expression. In contrast, heterozygous alpha1 isoform mice showed increased locomotor response to methamphetamine and increased basal and stimulated corticosterone in plasma. The learning and memory deficits observed in the alpha2 and alpha3 heterozygous mice reveal the Na,K-ATPase to be an important factor in the functioning of pathways associated with spatial learning. The neurobehavioral changes seen in heterozygous mice suggest that these mouse models may be useful in future investigations of the associated human CNS disorders.


Figures

Figure 1.
Figure 1.
Na,K-ATPase isoforms are reduced in gene-targeted mice. A, Reduced Na,K-ATPase α3 isoform mRNA expression in embryonic E18.5 d brains from WT, heterozygous (+/−), and homozygous (−/−) α3 knock-out mice by Northern blot. L32 was used as a loading control. Twenty micrograms of total RNA were loaded per lane. B, RT-PCR analysis of RNA from WT, heterozygous (+/−), and homozygous (−/−) α3 knock-out mice shows larger RNA transcript in −/− (arrow) but not +/− or WT mice. C, Western blot analysis of Na,K-ATPase isoforms in whole tissue extracts from hippocampus of adult male α1+/−, α2+/−, and α3+/− mice. Total protein loaded per lane was as follows: 10, 0.5, and 1 μg for α1, α2, and α3 isoform expression, respectively. D, Semiquantitation by densitometry on whole tissue extracts from adult hippocampus of α1+/−, α2+/−, and α3+/− mice shows reduction in α1, α2, and α3 isoforms, respectively. *p < 0.05 versus WT.
Figure 2.
Figure 2.
Elevated zero maze. Na,K-ATPase α2+/− mice display reduced time in open and a reduced number of entries into open quadrants compared with WT (WT, n = 36; α1+/−, n = 17; α2+/−, n = 19; and α3+/−, n = 11). Number of transitions is simply two times the number of open quadrant entries. A, Time in the open. B, Number open quadrant entries. C, Number of head dips. Mean ± SEM; *p < 0.05 versus WT.
Figure 3.
Figure 3.
Open-field locomotor activity. Altered distance moved (in centimeters) in Na,K-ATPase mice. Number of animals tested was as follows: WT, n = 36; α1+/−, n = 18; α2+/−, n = 19; α3+/−, n = 11. A, α2+/− mice tended to be hypoactive overall (inset) and were hypoactive during the first interval; α3+/− mice were hyperactive overall (inset) and during the first four intervals. No differences were noted between α1+/− and WT mice. B, Center distance (in centimeters) defined as activity more than three photobeams (3 cm) in from the side walls. α1+/− mice moved more during the first three intervals, α2+/− moved less during the first three intervals, and α3+/− mice moved more during the first four intervals in the central zone than WT. C, Margin (peripheral) distance (in centimeters) is distance moved within three photobeams of the side walls. The pattern is nearly the same as in A. D, Corner time (in seconds) is cumulative time within each interval spent interrupting one of the three photobeams closest to each corner. Inset, Total time spent in corners averaged across intervals. α1+/− and α3+/− spent less time in the corners and α2+/− spent more time in the corners than WT. Mean ± SEM; p < 0.10, *p < 0.05, **p < 0.01, ***p < 0.001 versus WT.
Figure 4.
Figure 4.
Open-field locomotor activity as distance moved (in centimeters) before and after stimulant challenge with methamphetamine. Activity was monitored for 30 min before administration of 1 mg/kg subcutaneous dose of (+)-methamphetamine and for 2 h after injection. Number of animals used was as follows: WT, n = 36; α1+/−, n = 18; α2+/−, n = 19; α3+/−, n = 11. There was a genotype × interval interaction by ANCOVA. Post-methamphetamine distances are adjusted means ± SEM for the covariate (last 2 pre-methamphetamine intervals). α3+/− mice showed an increased response compared with WT during the first 13 intervals, whereas the α1+/− mice showed increased activity during the first 12 intervals similar to the α3+/− mice (but not to the same extent) and then continued at a higher level than WT. α2+/− mice showed a response that was comparable with WT mice.
Figure 5.
Figure 5.
Plasma corticosterone. Augmentation of corticosterone in α1+/− mice but not α2+/− or α3+/− mice compared with WT. Data are mean ± SEM. A, Release of corticosterone under basal conditions in α1+/− mice is augmented relative to α2+/−, α3+/−, and WT mice. Group sizes are as follows: WT, n = 10; α1+/−, n = 10; α2+/−, n = 10; α3+/−, n = 10. B, Mice were challenged with methamphetamine and examined by locomotor testing for 2.5 h, and then corticosterone was assayed in plasma by enzyme immunoassay. Group sizes are as follows: WT, n = 35; α1+/−, n = 18; α2+/−, n = 19; α3+/−, n = 11. *p < 0.05 versus WT.
Figure 6.
Figure 6.
Morris water maze. A, Na,K-ATPase α3+/− mice took significantly longer to reach the visible platform on days 2–5 on cued trials but caught up to WT by day 6. B, Average speed during the hidden platform acquisition phase. There was a main effect of genotype (inset) that showed that the α1+/− mice swam significantly faster than WT, and α3+/− mice swam slightly slower compared with WT. C, Latencies to reach the platform during the acquisition phase of hidden platform learning. There was a significant main effect of genotype in which the α2+/− and α3+/− mice had longer escape latencies than WT mice (inset). D, Latencies on the reversal phase of hidden platform learning; there were no significant effects of genotype. E, Latencies on the double-reversal phase of hidden platform learning using a smaller platform (25% the size of the starting platform. The smaller platform was used to increase the accuracy required to locate the goal). There was a significant interaction between day of testing and genotype (for details, see Results). F, Latencies to reach the platform combined across each of the three phases of hidden platform learning. There was an overall effect in which the α2+/− and α3+/− mice had longer escape latencies than WT. Data are mean ± SEM. Number of animals tested are as follow: WT, n = 36; α1+/−, n = 18; α2+/−, n = 19; α3+/−, n = 11. *p < 0.05; **p < 0.01; ***p < 0.001 versus WT.
Figure 7.
Figure 7.
Morris water maze. Data are for cumulative distance from the platform during the acquisition phase of hidden platform learning. Cumulative distance is the distance from the mouse to the center of the platform (in centimeters) recorded every 200 ms. There was a main effect across days of genotype in which the α3+/− mice were farther from the platform on average than were WT mice. Number of animals tested were as follows: WT, n = 31; α1+/−, n = 18; α2+/−, n = 5; α3+/−, n = 10. Data are mean ± SEM. **p < 0.01 versus WT.
Figure 8.
Figure 8.
Morris water maze probe trials. At 24 h after receiving 24 learning trials to find the hidden platform, a single probe trial is given to determine whether the animal remembers the location of the platform. For the probe trial, the platform is removed and the performance of the mouse is monitored for 30 s. A, Distance (in centimeters) swum in the target quadrant after acquisition training and α1+/− mice spent more time in the quadrant compared with WT mice. B, Distance (in centimeters) swum in the target quadrant after double-reversal training with the small platform, and the α3+/− mice showed slightly reduced distance traveled. C, Time in the target quadrant during double-reversal training, and the α3+/− mice spent less time in the target quadrant. D, Average distance from the center point in which the platform used to be and the α3+/− mice were farther from the former platform site. Number of animals tested was as follows: WT, n = 31; α1+/−, n = 18; α2+/−, n = 5; α3+/−, n = 10. Data shown are mean ± SEM. Data were analyzed with and without the α2+/− group to determine whether this groups smaller n affected the outcome; it did not. p < 0.10, *p < 0.05, **p < 0.01 compared with WT for three-group ANOVA.
Figure 9.
Figure 9.
NMDA receptor expression. NR1 subunit is downregulated in the Na,K-ATPase α3+/− mice. A, Representative Western blot analysis of the NMDA receptor NR1 subunit in whole tissue extracts from hippocampus of adult male α1+/−, α2+/−, and α3+/− mice. Total protein loaded per lane is 2 μg. B, Semiquantitation by densitometry on whole tissue extracts from hippocampus from adult α1+/−, α2+/−, and α3+/− mice show reduction in NR1 in the α3+/− mice only (n = 3 per group). *p < 0.05 versus WT.

References

    1. Anagnostopoulos AV, Mobraaten LE, Sharp JJ, Davisson MT. Transgenic and knockout databases: behavioral profiles of mouse mutants. Physiol Behav. 2001;73:675–689. - PubMed
    1. Bannerman DM, Rawlins JN, McHugh SB, Deacon RM, Yee BK, Bast T, Zhang WN, Pothuizen HH, Feldon J. Regional dissociations within the hippocampus: memory and anxiety. Neurosci Biobehav Rev. 2004;28:273–283. - PubMed
    1. Blasi JM, Cena V, Gonzalez-Garcia C, Marsal J, Solsona C. Ouabain induces acetylcholine release from pure cholinergic synaptosomes independently of extracellular calcium concentration. Neurochem Res. 1988;13:1035–1041. - PubMed
    1. Bolivar V, Cook M, Flaherty L. List of transgenic and knockout mice: behavioral profiles. Mamm Genome. 2000;11:260–274. - PubMed
    1. Broadbent NJ, Squire LR, Clark RE. Spatial memory, recognition memory, and the hippocampus. Proc Natl Acad Sci USA. 2004;101:14515–14520. - PMC - PubMed

Publication types