. 2007 Jan 30;104(5):1516-21.
doi: 10.1073/pnas.0609775104. Epub 2007 Jan 18.

A functional study of plasma-membrane calcium-pump isoform 2 mutants causing digenic deafness

Affiliations

A functional study of plasma-membrane calcium-pump isoform 2 mutants causing digenic deafness

R Ficarella et al. Proc Natl Acad Sci U S A. .

Abstract

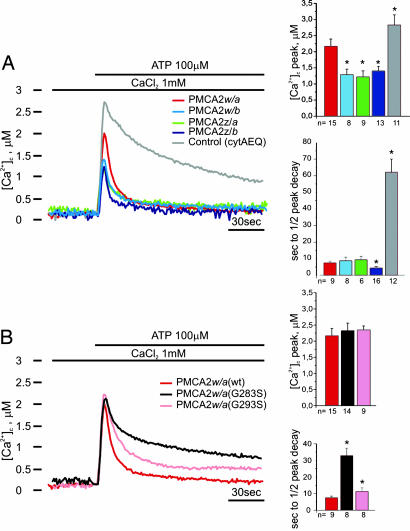
Ca2+ enters the stereocilia of hair cells through mechanoelectrical transduction channels opened by the deflection of the hair bundle and is exported back to endolymph by an unusual splicing isoform (w/a) of plasma-membrane calcium-pump isoform 2 (PMCA2). Ablation or missense mutations of the pump cause deafness, as described for the G283S mutation in the deafwaddler (dfw) mouse. A deafness-inducing missense mutation of PMCA2 (G293S) has been identified in a human family. The family also was screened for mutations in cadherin 23, which accentuated hearing loss in a previously described human family with a PMCA2 mutation. A T1999S substitution was detected in the cadherin 23 gene of the healthy father and affected son but not in that of the unaffected mother, who presented instead the PMCA2 mutation. The w/a isoform was overexpressed in CHO cells. At variance with the other PMCA2 isoforms, it became activated only marginally when exposed to a Ca2+ pulse. The G293S and G283S mutations delayed the dissipation of Ca2+ transients induced in CHO cells by InsP3. In organotypic cultures, Ca2+ imaging of vestibular hair cells showed that the dissipation of stereociliary Ca2+ transients induced by Ca2+ uncaging was compromised in the dfw and PMCA2 knockout mice, as was the sensitivity of the mechanoelectrical transduction channels to hair bundle displacement in cochlear hair cells.


Conflict of interest statement

The authors declare no conflict of interest.

Figures

Fig. 1.
Fig. 1.
Association of digenic mutations of PMCA2 and CDH23 with hearing loss. (A) Pedigree of an Italian family. Black symbols denote the family members affected. Genotypes of PMCA2 and CDH23 are indicated for each individual. (B) Representative chromatogram of CDH23 C5996G and PMCA2 G877A, respectively, which were identified from the family.
Fig. 2.
Fig. 2.
Immunolocalization of recombinant PMCA2 variants and mutants in transiently transfected CHO cells. (AD) PMCA2 variants w/b (A), z/a (B), z/b (C), and w/a (D). The interaction with antibody 5F10 was revealed by the Alexa Fluor 488-conjugated secondary antibody. (E and F) PMCA mutants on the w/a construct G283S (E) and G293S (F) were stained with antibody 2N, and the interaction was visualized by the Alexa Fluor 488-conjugated secondary antibody. The plasma membrane pattern of the overexpressed proteins in representative cells is shown. (G) The level of fluorescence in the plasma membrane was quantified as described in Materials and Methods. The SDs are indicated by the bars. Immunocytochemistry was performed as described in Materials and Methods. (Scale bars, 20 μm.)
Fig. 3.
Fig. 3.
Activity of recombinant PMCA2 isoforms (A) and of the mutated w/a isoforms (B) in CHO cells. CHO cells were transiently cotransfected with the PMCA2 variants and cytAEQ or with only cytAEQ (as a control). The cells were then perfused with KRB supplemented with CaCl2 (1 mM). We used 100 μM ATP to produce a transient increase of [Ca2+]c. The histograms show the means ± SD of [Ca2+]c peaks and of the half-peak decay times. The traces are representative of at least eight experiments. ∗, P < 0.01 calculated with respect to PMCA2w/a.
Fig. 4.
Fig. 4.
Ca2+ extrusion and MET currents in hair cells of PMCA2 KO and dfw mice. (A) Time sequence of confocal images before and after UV photolysis of caged calcium in hair cells of an utricle culture (P2) from PMCA2 KO mice. Timing relative to the onset of the 100-ms UV light (375 nm) delivery is shown on each numbered frame. The example of Ca2+ concentration change was probed by the Δf/f0 signal encoded by the color scale bar beneath frame 1. (B) Time course of normalized fluorescence ratio changes (Δf/f0)n evoked by Ca2+ photoliberation. Each data point is averaged over n > 13 cells in two to four mice of each type, encoded by colored lines (solid lines, stereocilia; dashed lines, cell body excluding stereocilia) for WT controls (wt, blue traces), dfw (green traces), and PMCA2 KO (black traces) mice. The arrowheads below the time axis show the time of frame capture from A. (C) Same as B for the first 15 s after UV application. (Inset) Decay time constants τ were derived by a single-exponential fit. The ANOVA test gave P < 10−4 and P = 0.03 for compatibility of stereociliary τ of WT dfw and dfw KO, respectively. (D) MET currents in OHCs for displacements of the tip of the hair bundle toward or away from the kinocilium. In the stimulus monitor shown at the bottom, positive steps indicate (excitatory) movements toward the highest stereocilia. Inward currents are given as negative relative to the current level in the absence of bundle stimulation at the holding potential, −80 mV. The high-frequency oscillations in the current traces were due to imperfectly cancelled environmental mechanical disturbances. Each response is the average of 10 presentations. (E) Plots of peak MET current versus displacement, Δx, of the tip of the hair bundle. Peak current was measured from records like those in D expressed as the difference in current relative to that obtained with a large negative displacement, where all transducer channels are assumed to be closed, and peak current was normalized to yield a measure of channel open probability (Popen, ordinates). Smooth curves are least-square fits calculated from Popen = 1/(1 + eA2(X2−Δx)·(1 + eA1(X1−Δx))), where A1, A2, X1, and X2 are fit parameters. For WT, A1 = 13.91 ± 2.35 μm−1, A2 = 7.17 ± 0.77 μm−1, X1 = 0.14 ± 0.03 μm, and X2 = 0.20 ± 0.02 μm; for dfw, A1 = 9.85 ± 1.15 μm−1, A2 = 3.99 ± 0.43 μm−1, X1 = 0.21 ± 0.03 μm, and X2 = 0.43 ± 0.01 μm; and for KO, A1 = 13.79 ± 1.09 μm−1, A2 = 4.34 ± 0.19 μm−1, X1 = 0.14 ± 0.01 μm, and X2 = 0.37 ± 0.01 μm.

References

    1. Fuchs PA. J Physiol. 2005;566:7–12. - PMC - PubMed
    1. Lim DJ. Hear Res. 1986;22:117–146. - PubMed
    1. Fettiplace R, Hackney CM. Nat Rev Neurosci. 2006;7:19–29. - PubMed
    1. Corey DP, Sotomayor M. Nature. 2004;428:901–903. - PubMed
    1. Anniko M, Wroblewski R. Hear Res. 1986;22:279–293. - PubMed

Publication types

Substances