. 2007 Jan 15;21(2):206-20.
doi: 10.1101/gad.406207.

Telomerase abrogation dramatically accelerates TRF2-induced epithelial carcinogenesis

Affiliations

Telomerase abrogation dramatically accelerates TRF2-induced epithelial carcinogenesis

Raquel Blanco et al. Genes Dev. .

Abstract

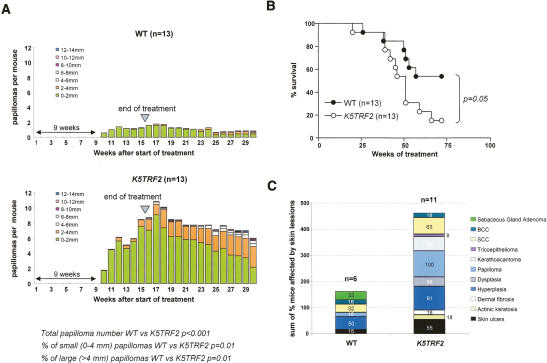
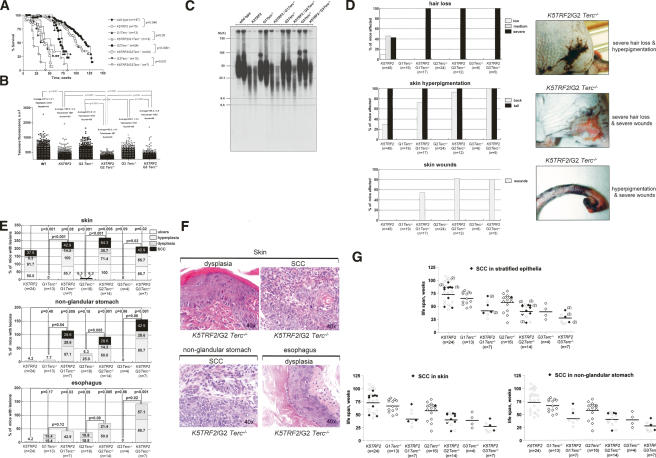
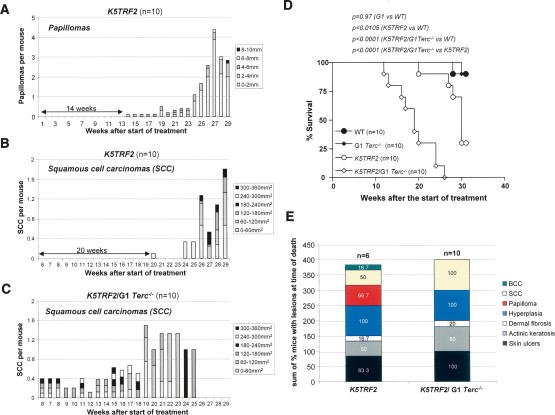
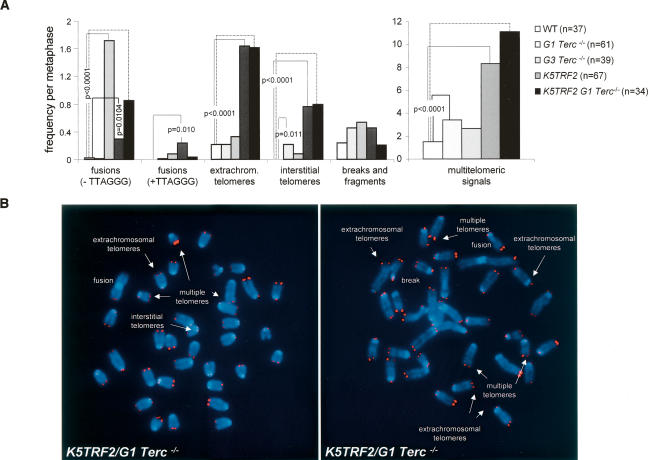
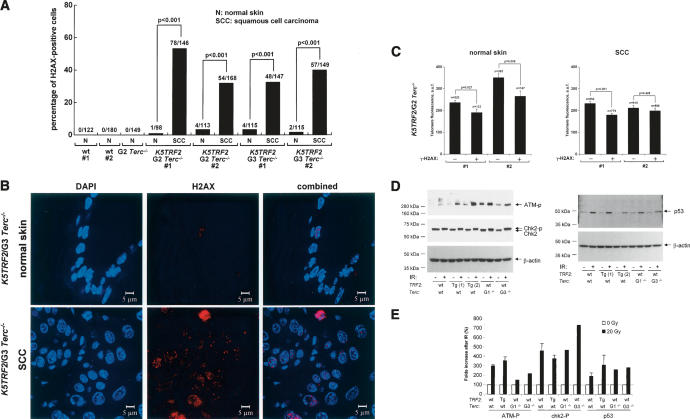
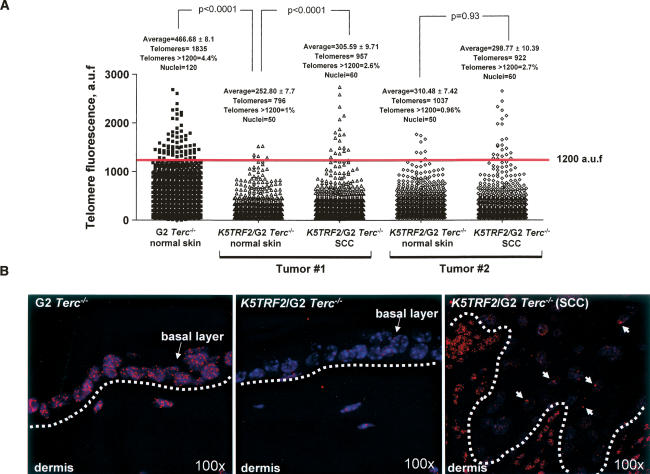
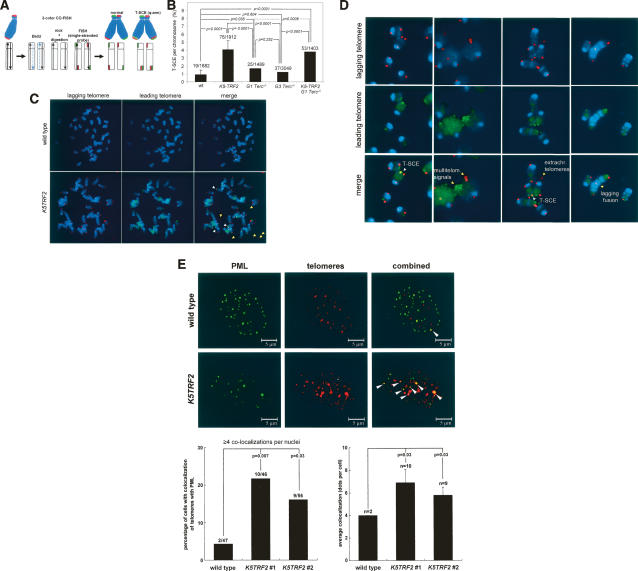
TRF2 is a telomere-binding protein with roles in telomere protection and telomere-length regulation. The fact that TRF2 is up-regulated in some human tumors suggests a role of TRF2 in cancer. Mice that overexpress TRF2 in the skin, K5TRF2 mice, show critically short telomeres and are susceptible to UV-induced carcinogenesis as a result of deregulated XPF/ERCC1 activity, a nuclease involved in UV damage repair. Here we demonstrate that, when in combination with telomerase deficiency, TRF2 acts as a very potent oncogene in vivo. In particular, we show that telomerase deficiency dramatically accelerates TRF2-induced epithelial carcinogenesis in K5TRF2/Terc-/- mice, coinciding with increased chromosomal instability and DNA damage. Telomere recombination is also increased in these mice, suggesting that TRF2 favors the activation of alternative telomere maintenance mechanisms. Together, these results demonstrate that TRF2 increased expression is a potent oncogenic event that along with telomerase deficiency accelerates carcinogenesis, coincidental with a derepression of telomere recombination. These results are of particular relevance given that TRF2 is up-regulated in some human cancers. Furthermore, these data suggest that telomerase inhibition might not be effective to cease the growth of TRF2-overexpressing tumors.


Figures

Figure 1.
Figure 1.
K5TRF2 mice are more susceptible to multistage carcinogenesis protocols. (A) Average number of papillomas per mouse at the indicated times after the start of DMBA/TPA treatment. The treatment was interrupted at week 15 (arrow). The time at which the first lesions appeared is also indicated. n = number of mice of each genotype. Statistical comparisons using the Wilcoxon-Mann-Whitney rank sum test of papilloma number and size between wild-type and K5TRF2 mice during the 30-wk duration of the experiment are indicated. (B) Survival of DMBA + TPA-treated wild-type and K5TRF2 mice. Statistical significance of the difference in survival between genotypes using the log rank test is indicated. (C) Percentage of wild-type and K5TRF2 mice showing the indicated skin lesions after full histopathological analysis.
Figure 2.
Figure 2.
Decreased survival, severe skin lesions, and accelerated carcinogenesis in K5TRF2/Terc−/− mice. (A) Survival of mice of the indicated genotype as a function of age. Statistical significance of the differences in survival using the log rank test is indicated. (B) Telomere fluorescence as determined by Q-FISH in skin sections of the indicated genotypes. Between 45 and 100 keratinocyte nuclei and 500–2000 telomere dots from one to two mice of each genotype were analyzed by Q-FISH. Average fluorescence in arbitrary units (auf) and standard error are shown. Statistical significance is indicated for each comparison. Telomere fluorescence values should be compared within each experiment due to variations in fluorescence intensity between experiments. (C) Telomere length as determined by TRF in adult skin keratinocytes of the indicated genotypes. Note increased TRF size in third-generation K5TRF2/G3Terc−/− mice compared with earlier K5TRF2/Terc−/− generations. (D) Quantification of skin pathologies, as well as representative examples, in G1 to G3 K5TRF2/Terc−/− mice and the K5TRF2 and G1 to G3 Terc−/− controls. (E) Percentage of mice of the indicated genotype showing preneoplastic (hyperplasia, dysplasia) and neoplastic lesions (SCC) in different stratified epithelia at the time of death. Frequency of skin ulcers in sacrificed mice is higher than that shown in D since we only included moribund mice, while D shows the incidence of lesions in all the mouse cohort including healthy animals. (F) Representative examples (40× magnification) of the indicated preneoplastic and neoplastic lesions in stratified epithelia from K5TRF2/Terc−/− mice. The image corresponding to “skin dysplasia” shows irregular growth pattern with hyperkeratosis, squamous cell hyperplasia, hyperchromatic nuclei, and prominent nucleoli. The image corresponding to a “skin SCC” shows nests of squamous cells with invasive growth of the dermis, as well as numerous mitotic figures and nuclear atypias. The image corresponding to a “nonglandular stomach SCC” shows endophytic evidence of invasive growth of the muscularis mucosae, with some hyperchromatic cells with prominent nucleoli and numerous mitotic figures. The “esophagus” dysplasia shows diffuse thickening of the squamous epithelium and dysplastic basal cell proliferation. Note that in SCC, the tumoral cells interrupt the basal membrane in both the skin and the nonglandular stomach. (G) Onset of SCC with age in increasing generations of K5TRF2/Terc−/− mice and the K5TRF2 and G1 to G3 Terc−/− controls. Each rectangle represents a mouse. White rectangles indicate mice without SCC at the time of death; black rectangles indicate mice with one or more SCC at the time of death. The number in parentheses indicates the number of SCC of independent origin per mouse. The upper graph summarizes SCC in skin and nonglandular stomach; parentheses indicate the number of independent SCC per mouse in different locations.
Figure 3.
Figure 3.
Telomerase deficiency accelerates UV-induced carcinogenesis in K5TRF2/Terc−/− mice compared with K5TRF2 controls. (A) Total number of papillomas per mouse in K5TRF2 mice after chronic UVB irradiation. (B) Number of carcinomas per mouse in K5TRF2 mice after chronic UVB irradiation. (C) Number of carcinomas per mouse in K5TRF2/Terc−/− mice after chronic UVB irradiation. (D) Survival curve of chronically irradiated K5TRF2/Terc−/− and K5TRF2 cohorts. All irradiated K5TRF2/Terc−/− mice were dead at week 26 after the start of the treatment due to large skin tumors, while control K5TRF2 mice showed longer survival. The statistical significance of differences in survival using the log rank test is indicated. (E) Percentage of K5TRF2/G1Terc−/− and K5TRF2 mice showing the indicated skin lesions at time of death after full histopathological analysis. Of notice, 100% of K5TRF2/Terc−/− mice presented SCC lesions at the time of death.
Figure 4.
Figure 4.
Increased chromosomal instability in K5TRF2/Terc−/− mice. (A) Quantification of frequency of chromosomal aberrations per metaphase in the indicated genotypes. Note that end-to-end fusions lacking TTAGGG repeats at the fusion point (−TTAGGG) are increased in G3 Terc−/− and K5TRF2/G1Terc−/− cells compared with K5TRF2 controls, suggesting that they are the consequence of telomere shortening. Extrachromosomal telomere signals, multitelomeric signals, and interstitial telomeres are specifically increased in K5TRF2 and K5TRF2/Terc−/− cells but not in G3 Terc−/− cells, suggesting that they are the consequence of TRF2 overexpression. Statistically significant differences are indicated. Up to six independent keratinocyte cultures were analyzed per genotype. n = number of metaphases analyzed. (B) Representative examples of the indicated chromosomal aberrations (indicated by white arrows).
Figure 5.
Figure 5.
Increased γH2AX foci in K5TRF2 cells and K5TRF2/Terc−/− tumors. (A) Quantification of percentage of nuclei containing γH2AX foci in normal skin of the indicated genotypes, as well as various SCC in G2 and G3 K5TRF2/Terc−/− mice (n = 2) compared with the normal surrounding tissue. The number of γH2AX-positive cells out of the total number of cells analyzed is indicated. Statistical significance of differences between the SCC and the normal surrounding tissue are indicated. (B) Representative examples of γH2AX staining in a K5TRF2/G3Terc−/− SCC compared with the corresponding normal surrounding tissue. Magnification bars correspond to 5 μm. (C) Telomere fluorescence as determined by Q-FISH directly on skin cells that are positive (+) or negative (−) for γH2AX foci. #1 and #2 correspond to two independent pairs of normal skin and the SCC in K5TRF2/G2Terc−/− mice. Note shorter telomeres in γH2AX-positive than in γH2AX-negative cells. The statistical significance of differences in telomere length is indicated. (D) Western blot analysis of ATM-P, ChK2, and p53 in keratinoctytes of the indicated genotypes before (−) and after (+) ionizing radiation. Phosphorylated Chk2 (Chk2-P) is detected as a change in the Chk2 mobility in the gel. Actin was used as a loading control. (E) Quantification of ATM-P, ChK2-P, and p53 levels in keratinoctytes of the indicated genotypes before (−) and after (+) ionizing radiation after normalization to actin levels. Note a similar ATM phosphorylation, ChK2 phosphorylation, as well as p53 accumulation after ionizing radiation in the different genotypes.
Figure 6.
Figure 6.
Presence of very intense telomere fluorescence signals in K5TRF2/G2Terc−/− tumors compared with normal surrounding tissue. (A) Quantification of telomere fluorescence in tumor sections (SCC) from two independent K5TRF2/G2Terc−/− mice compared with their normal surrounding skin. As control, telomere length of normal skin from G2Terc−/− mice was also determined. More than 50 nuclei and >700 telomere signals from each genotype and condition were analyzed by Q-FISH. Average fluorescence in arbitrary units (auf) and standard error are shown. The percentage of telomere signals with >1200 auf are also indicated with a red line. Statistical significance is indicated for each comparison. The tumoral tissue showed the presence of very intense telomere fluorescence signals, which were not present in the normal surrounding tissue. (B) Representative images of telomere fluorescence in normal skin and tumor sections from the indicated mice. The basal layer of skin keratinocytes is indicated with an arrow and separated from the dermis by a white lane. White arrows indicate very intense telomere signals within the tumoral tissue. Magnification is 100×.
Figure 7.
Figure 7.
Increased telomere recombination and APBs in K5TRF2/Terc−/− mice. (A) The scheme depicts the CO-FISH technique to label telomeres produced by either leading-strand (green color) or lagging-strand synthesis (red color). A sister-chromatid exchange within telomeric DNA (T-SCE) at one of the chromosome arms (i.e., q-arm) leads to the splitting of the hybridization signals to both sister chromatid telomeres, resulting in the mixture of red and green fluorescence. (B) Quantification of T-SCE in the indicated genotypes. The number of T-SCE events out of the total number of chromosomes analyzed is indicated on top of each bar. A significant increase in T-SCE is observed in K5TRF2 and K5TRF2/G1Terc−/− cultures compared with wild-type, G1, and G3 Terc−/− controls. Error bars correspond to two to five independent keratinocyte cultures. (C) Representative CO-FISH images of metaphases hybridized with probes against the leading (green fluorescence) and lagging (red fluorescence) telomere. T-SCE events are indicated with white arrows. Note that extrachromosomal telomere signals involving lagging telomeres, multitelomeric signals, and end-to-end fusions are indicated with yellow arrows. (D) Representative CO-FISH images of chromosome aberrations hybridized with probes against the leading (green fluorescence) and lagging (red fluorescence) telomere in a K5TRF2 keratinocyte culture. T-SCE events are indicated with white arrows. Extrachromosomal telomere signals involving lagging telomeres, multitelomeric signals involving both lagging and leading telomeres, as well as a chromatid-type end-to-end fusion involving lagging telomeres are indicated with yellow arrows. The exposition time in K5TRF2 and K5TRF2/Terc−/− keratinocytes was increased compared with wild type in order to be able to detect telomere signals due to the short telomeres present in these genotypes. (E) Confocal microscopy images showing either PML fluorescence (green), telomere fluorescence (red), or combined fluorescence (yellow) in wild-type and K5TRF2 keratinocytes. Arrows indicate colocalization of PML and telomeres. Quantification of percentage of cells showing colocalization of telomeres with PML protein is also shown. A cell was considered positive when it showed four or more colocalization events. An increased frequency of cells showing APBs is observed in two independent K5TRF2 cultures (#1 and #2) compared with wild-type controls. Quantification of the number of APBs per nuclei in the indicated genotypes is also shown. A significant increase in the number of APBs per nuclei is observed in K5TRF2 cultures compared with the wild-type controls.

Similar articles

Cited by

References

    1. Artandi S.E., Chang S., Lee S.L., Alson S., Gottlieb G.J., Chin L., DePinho R.A., Chang S., Lee S.L., Alson S., Gottlieb G.J., Chin L., DePinho R.A., Lee S.L., Alson S., Gottlieb G.J., Chin L., DePinho R.A., Alson S., Gottlieb G.J., Chin L., DePinho R.A., Gottlieb G.J., Chin L., DePinho R.A., Chin L., DePinho R.A., DePinho R.A. Telomere dysfunction promotes non-reciprocal translocations and epithelial cancers in mice. Nature. 2000;406:641–645. - PubMed
    1. Bailey S.M., Brenneman M.A., Goodwin E.H., Brenneman M.A., Goodwin E.H., Goodwin E.H. Frequent recombination in telomeric DNA may extend the proliferative life of telomerase-negative cells. Nucleic Acids Res. 2004;32:3743–3751. - PMC - PubMed
    1. Balmain A., Ramsden M., Bowden G.T., Smith J., Ramsden M., Bowden G.T., Smith J., Bowden G.T., Smith J., Smith J. Activation of the mouse Harvey-ras gene in chemically induced benign skin papillomas. Nature. 1984;307:658–660. - PubMed
    1. Bechter O.E., Zou Y., Walker W., Wright W.E., Shay J.W., Zou Y., Walker W., Wright W.E., Shay J.W., Walker W., Wright W.E., Shay J.W., Wright W.E., Shay J.W., Shay J.W. Telomeric recombination in mismatch repair deficient human colon cancer cells and telomerase inhibition. Cancer Res. 2004;64:3444–3451. - PubMed
    1. Biroccio A., Rizzo A., Elli R., Koering C.E., Belleville A., Benassi B., Leonetti C., Stevens M.F., D’Incalci M., Zupi G., Rizzo A., Elli R., Koering C.E., Belleville A., Benassi B., Leonetti C., Stevens M.F., D’Incalci M., Zupi G., Elli R., Koering C.E., Belleville A., Benassi B., Leonetti C., Stevens M.F., D’Incalci M., Zupi G., Koering C.E., Belleville A., Benassi B., Leonetti C., Stevens M.F., D’Incalci M., Zupi G., Belleville A., Benassi B., Leonetti C., Stevens M.F., D’Incalci M., Zupi G., Benassi B., Leonetti C., Stevens M.F., D’Incalci M., Zupi G., Leonetti C., Stevens M.F., D’Incalci M., Zupi G., Stevens M.F., D’Incalci M., Zupi G., D’Incalci M., Zupi G., Zupi G., et al. TRF2 inhibition triggers apoptosis and reduces tumorigenicity of human melanoma cells. Eur. J. Cancer. 2006;42:1881–1888. - PubMed

Publication types

MeSH terms