

Whole genome microarray analysis of gene expression in Prader-Willi syndrome
- PMID: 17236194
- PMCID: PMC5467864
- DOI: 10.1002/ajmg.a.31606
Whole genome microarray analysis of gene expression in Prader-Willi syndrome
Abstract
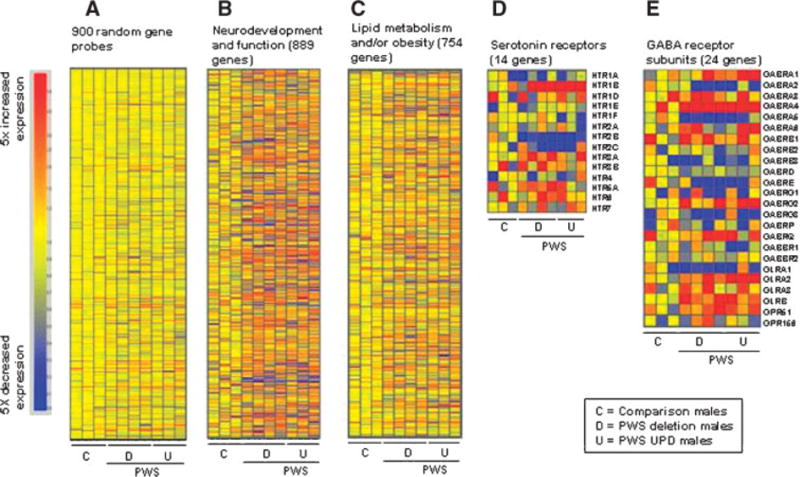
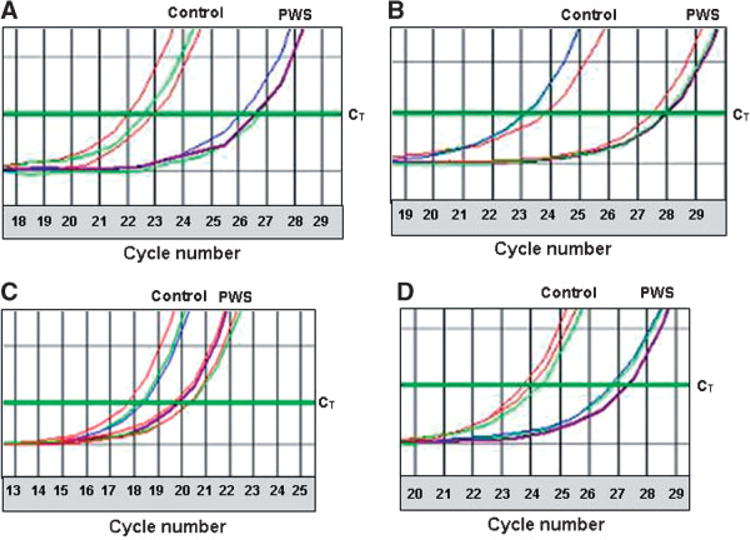
Prader-Willi syndrome (PWS) is caused by loss of function of paternally expressed genes in the 15q11-q13 region and a paucity of data exists on transcriptome variation. To further characterize genetic alterations in this classic obesity syndrome using whole genome microarrays to analyze gene expression, microarray and quantitative RT-PCR analysis were performed using RNA isolated from lymphoblastoid cells from PWS male subjects (four with 15q11-q13 deletion and three with UPD) and three age and cognition matched nonsyndromic comparison males. Of more than 47,000 probes examined in the microarray, 23,383 were detectable and 323 had significantly different expression in the PWS lymphoblastoid cells relative to comparison cells, 14 of which were related to neurodevelopment and function. As expected, there was no evidence of expression of paternally expressed genes from the 15q11-q13 region (e.g., SNRPN) in the PWS cells. Alterations in expression of serotonin receptor genes (e.g., HTR2B) and genes involved in eating behavior and obesity (ADIPOR2, MC2R, HCRT, OXTR) were noted. Other genes of interest with reduced expression in PWS subjects included STAR (a key regulator of steroid synthesis) and SAG (an arrestin family member which desensitizes G-protein-coupled receptors). Quantitative RT-PCR for SAG, OXTR, STAR, HCRT, and HTR2B using RNA isolated from their lymphoblastoid cells and available brain tissue (frontal cortex) from separate individuals with PWS and control subjects and normalized to GAPD gene expression levels validated our microarray gene expression data. Our analysis identified previously unappreciated changes in gene expression which may contribute to the clinical manifestations seen in PWS.
(c) 2007 Wiley-Liss, Inc.
Figures
Similar articles
-
Microarray analysis of gene/transcript expression in Prader-Willi syndrome: deletion versus UPD.J Med Genet. 2003 Aug;40(8):568-74. doi: 10.1136/jmg.40.8.568. J Med Genet. 2003. PMID: 12920063 Free PMC article.
-
Whole genome microarray analysis of gene expression in an imprinting center deletion mouse model of Prader-Willi syndrome.Am J Med Genet A. 2007 Mar 1;143A(5):422-9. doi: 10.1002/ajmg.a.31504. Am J Med Genet A. 2007. PMID: 17036336 Free PMC article.
-
A girl with incomplete Prader-Willi syndrome and negative MS-PCR, found to have mosaic maternal UPD-15 at SNP array.Am J Med Genet A. 2015 Nov;167A(11):2720-6. doi: 10.1002/ajmg.a.37222. Epub 2015 Jun 24. Am J Med Genet A. 2015. PMID: 26109092
-
Prader-Willi syndrome: clinical genetics, cytogenetics and molecular biology.Expert Rev Mol Med. 2005 Jul 25;7(14):1-20. doi: 10.1017/S1462399405009531. Expert Rev Mol Med. 2005. PMID: 16038620 Free PMC article. Review.
-
Genomic imprinting: potential function and mechanisms revealed by the Prader-Willi and Angelman syndromes.Mol Hum Reprod. 1997 Apr;3(4):321-32. doi: 10.1093/molehr/3.4.321. Mol Hum Reprod. 1997. PMID: 9237260 Review.
Cited by
-
Prader-Willi syndrome: a review of clinical, genetic, and endocrine findings.J Endocrinol Invest. 2015 Dec;38(12):1249-63. doi: 10.1007/s40618-015-0312-9. Epub 2015 Jun 11. J Endocrinol Invest. 2015. PMID: 26062517 Free PMC article. Review.
-
The relationship between endogenous oxytocin and vasopressin levels and the Prader-Willi syndrome behaviour phenotype.Front Endocrinol (Lausanne). 2023 May 29;14:1183525. doi: 10.3389/fendo.2023.1183525. eCollection 2023. Front Endocrinol (Lausanne). 2023. PMID: 37313445 Free PMC article.
-
EVALUATION OF PLASMA SUBSTANCE P AND BETA-ENDORPHIN LEVELS IN CHILDREN WITH PRADER-WILLI SYNDROME.J Rare Disord. 2015 Sep;3(2):http://www.journalofraredisorders.com/pub/IssuePDFs/Final.pdf. J Rare Disord. 2015. PMID: 27570781 Free PMC article.
-
Expression and regulation of nampt in human islets.PLoS One. 2013;8(3):e58767. doi: 10.1371/journal.pone.0058767. Epub 2013 Mar 11. PLoS One. 2013. PMID: 23536823 Free PMC article.
-
Do patients with Prader-Willi syndrome have favorable glucose metabolism?Orphanet J Rare Dis. 2022 May 7;17(1):187. doi: 10.1186/s13023-022-02344-3. Orphanet J Rare Dis. 2022. PMID: 35525976 Free PMC article. Review.
References
-
- Belelli D, Lambert JJ. Neurosteroids: Endogenous regulators of the GABA(A) receptor. Nat Rev Neurosci. 2005;6:565–575. - PubMed
Publication types
MeSH terms
Substances
Grants and funding
LinkOut - more resources
Full Text Sources
Medical
Molecular Biology Databases
Research Materials
