

Shifting of activation center in the brain during muscle fatigue: an explanation of minimal central fatigue?
- PMID: 17236789
- PMCID: PMC2701907
- DOI: 10.1016/j.neuroimage.2006.09.050
Shifting of activation center in the brain during muscle fatigue: an explanation of minimal central fatigue?
Abstract
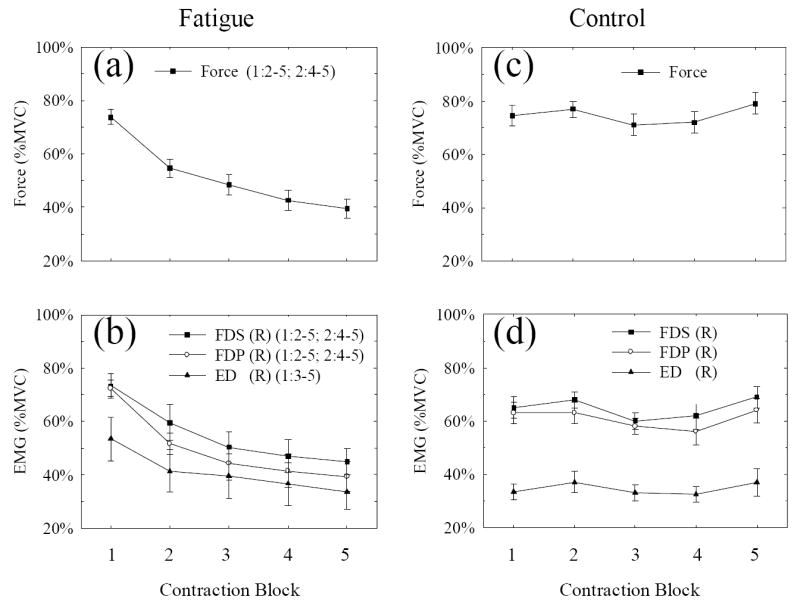
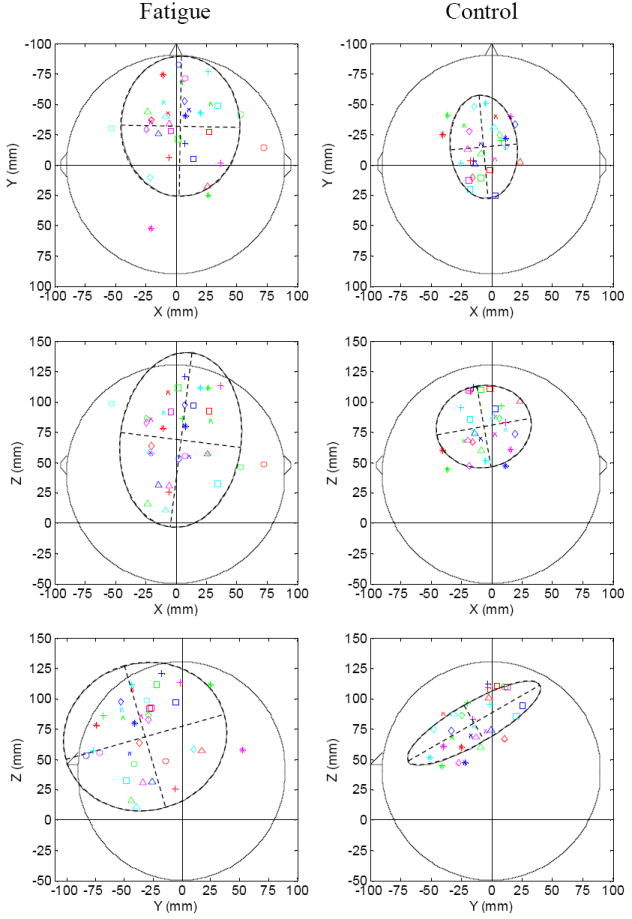
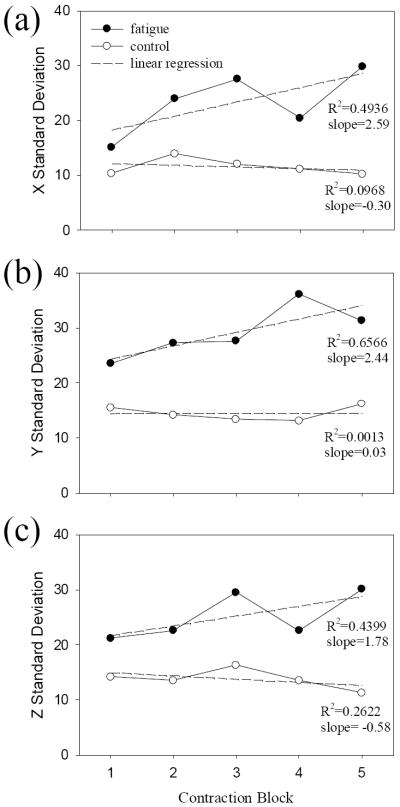
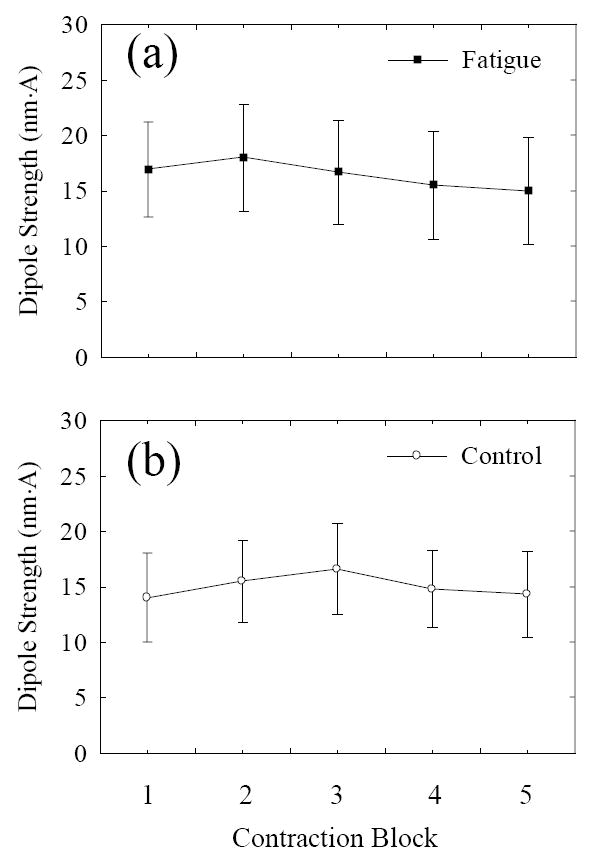
Accumulating evidence suggests that the overall level of cortical activation controlling a voluntary motor task that leads to significant muscle fatigue does not decrease as much as the activation level of the motoneuron pool projecting to the muscle. One possible explanation for this "muscle fatigue>cortical fatigue" phenomenon is that the brain is an organ with built-in redundancies: it has multiple motor centers and parallel pathways, and the center of activation may shift from one location to another when neurons in the previous location become fatigued. This hypothesis was tested by estimating the changes of source locations of high-density (64 channels) scalp electroencephalographic (EEG) signals collected during both fatigue and non-fatigue motor tasks. A current dipole model was used to estimate the EEG sources. The fatigue motor task induced significant muscle fatigue, and the non-fatigue task did not. The EEG signal source that indicated the center of brain activation showed substantial location shifts during the fatigue motor task. The shifts could not be explained by variations of source locations caused by error estimated from the non-fatigue task EEG and simulated data. Compared to the non-fatigue condition, the weighted-center of the source locations for all the participants shifted toward the right hemisphere (ipsilateral to the muscle activation), anterior, and inferior cortical regions under the fatigue condition. Fatigue did not alter dipole (source-signal) strength or the overall level of brain activation. The brain may avoid fatigue by shifting neuron populations that participate in a fatiguing motor task.
Figures
Similar articles
-
Nonlinear cortical modulation of muscle fatigue: a functional MRI study.Brain Res. 2002 Dec 13;957(2):320-9. doi: 10.1016/s0006-8993(02)03665-x. Brain Res. 2002. PMID: 12445974
-
Comparison of brain activation after sustained non-fatiguing and fatiguing muscle contraction: a positron emission tomography study.Exp Brain Res. 2005 May;163(1):65-74. doi: 10.1007/s00221-004-2141-5. Epub 2005 Jan 12. Exp Brain Res. 2005. PMID: 15645226
-
Investigating the modulation of brain activity associated with handgrip force and fatigue.Technol Health Care. 2015;23 Suppl 2:S427-33. doi: 10.3233/THC-150979. Technol Health Care. 2015. PMID: 26410509
-
Spinal and supraspinal factors in human muscle fatigue.Physiol Rev. 2001 Oct;81(4):1725-89. doi: 10.1152/physrev.2001.81.4.1725. Physiol Rev. 2001. PMID: 11581501 Review.
-
Evidence for a supraspinal contribution to human muscle fatigue.Clin Exp Pharmacol Physiol. 2006 Apr;33(4):400-5. doi: 10.1111/j.1440-1681.2006.04363.x. Clin Exp Pharmacol Physiol. 2006. PMID: 16620309 Review.
Cited by
-
Isometric Arm Forces Exerted by Females at Different Levels of Physical Comfort and Their EEG Signatures.Brain Sci. 2023 Jul 4;13(7):1027. doi: 10.3390/brainsci13071027. Brain Sci. 2023. PMID: 37508959 Free PMC article.
-
Fatigue versus activity-dependent fatigability in patients with central or peripheral motor impairments.Neurorehabil Neural Repair. 2008 Mar-Apr;22(2):105-10. doi: 10.1177/1545968308315046. Neurorehabil Neural Repair. 2008. PMID: 18285599 Free PMC article. Review.
-
Physical fatigue increases neural activation during eyes-closed state: a magnetoencephalography study.Behav Brain Funct. 2015 Nov 5;11(1):35. doi: 10.1186/s12993-015-0079-3. Behav Brain Funct. 2015. PMID: 26542654 Free PMC article.
-
Correlative Evaluation of Mental and Physical Workload of Laparoscopic Surgeons Based on Surface Electromyography and Eye-tracking Signals.Sci Rep. 2017 Sep 11;7(1):11095. doi: 10.1038/s41598-017-11584-4. Sci Rep. 2017. PMID: 28894216 Free PMC article.
-
Implicit and explicit learning strategies and fatigue: an evaluation of throwing task performance.Front Psychol. 2025 Jan 31;16:1438313. doi: 10.3389/fpsyg.2025.1438313. eCollection 2025. Front Psychol. 2025. PMID: 39958770 Free PMC article.
References
-
- Belhaj-Saïf A, Fourment A, Maton B. Adaptation of the precentral cortical command to elbow muscle fatigue. Exp Brain Res. 1996;111:405–416. - PubMed
-
- Bigland-Ritchie B. EMG/force relations and fatigue of human voluntary contractions. Exerc Sport Sci Rev. 1981;9:75–117. - PubMed
-
- Bonnard M, Sirin AV, Oddsson L, Thorstensson A. Different strategies to compensate for the effects of fatigue revealed by neuromuscular adaptation processes in humans. Neurosci Lett. 1994;166:101–105. - PubMed
Publication types
MeSH terms
Grants and funding
LinkOut - more resources
Full Text Sources
