. 2007 Apr 1;92(7):2476-90.
doi: 10.1529/biophysj.106.099549. Epub 2007 Jan 19.

Stiffness and fraction of Myosin motors responsible for active force in permeabilized muscle fibers from rabbit psoas

Affiliations

Stiffness and fraction of Myosin motors responsible for active force in permeabilized muscle fibers from rabbit psoas

Marco Linari et al. Biophys J. .

Abstract

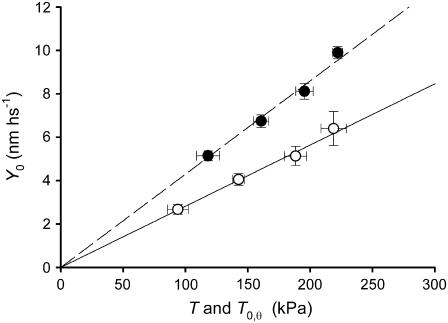
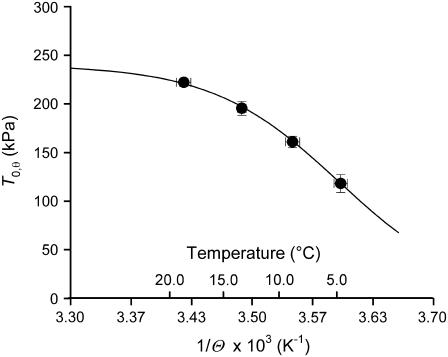
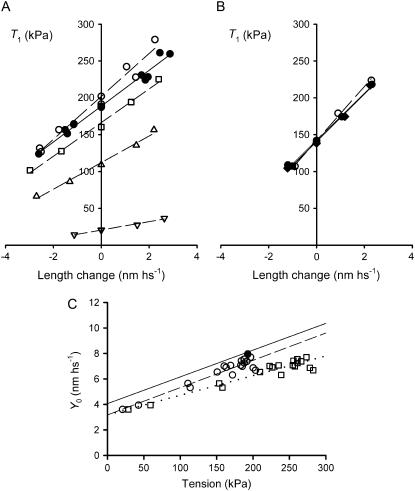
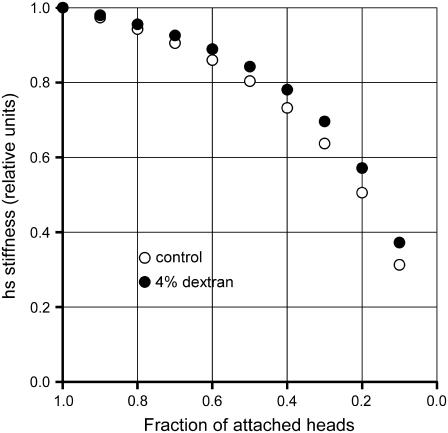
The stiffness of the single myosin motor (epsilon) is determined in skinned fibers from rabbit psoas muscle by both mechanical and thermodynamic approaches. Changes in the elastic strain of the half-sarcomere (hs) are measured by fast mechanics both in rigor, when all myosin heads are attached, and during active contraction, with the isometric force (T0) modulated by changing either [Ca2+] or temperature. The hs compliance is 43.0+/-0.8 nm MPa-1 in isometric contraction at saturating [Ca2+], whereas in rigor it is 28.2+/-1.1 nm MPa-1. The equivalent compliance of myofilaments is 21.0+/-3.3 nm MPa-1. Accordingly, the stiffness of the ensemble of myosin heads attached in the hs is 45.5+/-1.7 kPa nm-1 in isometric contraction at saturating [Ca2+] (e0), and in rigor (er) it rises to 138.9+/-21.2 kPa nm-1. Epsilon, calculated from er and the lattice molecular dimensions, is 1.21+/-0.18 pN nm-1. epsilon estimated, using a thermodynamic approach, from the relation of T0 at saturating [Ca2+] versus the reciprocal of absolute temperature is 1.25+/-0.14 pN nm-1, similar to that estimated for fibers in rigor. Consequently, the ratio e0/er (0.33+/-0.05) can be used to estimate the fraction of attached heads during isometric contraction at saturating [Ca2+]. If the osmotic agent dextran T-500 (4 g/100 ml) is used to reduce the lateral filament spacing of the relaxed fiber to the value before skinning, both e0 and er increase by approximately 40%. Epsilon becomes approximately 1.7 pN nm-1 and the fraction and the force of myosin heads attached in the isometric contraction remain the same as before dextran application. The finding that the fraction of myosin heads attached to actin in an isometric contraction is 0.33 rules out the hypothesis of multiple mechanical cycles per ATP hydrolyzed.


Figures

FIGURE 1
FIGURE 1
Temperature-jump protocol. (A) Temperature change (lower trace) measured by a miniaturized (diameter, 25 μm) fast thermocouple mounted in place of the fiber during the transition from the low-temperature (1°C) to the high-temperature drop (12°C). The upper trace indicates stepper motor start (↓) and stop (↑), and the middle trace is the force transducer signal. The artifacts in the force mark the start of the stepper motor motion for drop change (a) and the times when the probe leaves the first (b) and enters the second drop (c). The time of travel in air (∼90 ms) is marked by vertical dashed lines. The temperature gradient in air is ∼2.2°C mm−1, 30% of the temperature difference between the two drops. The remaining 70% change in temperature occurs within 3–5 ms, at the interface of the high-temperature drop. (B) Force response to activation by Ca2+ at the test temperature (a) and at the low temperature followed by temperature jump (b). The arrow (↑) in a indicates the transition from preactivating to activating solution; in b, it indicates the transition from low- to high-temperature activating solution. A large release (∼8% of the initial fiber length, applied at the time marked in both panels by the vertical bar) was used to drop the force from the isometric tetanic force to zero. The arrow (↓) indicates the transition from activating solution to relaxing solution. The horizontal lines indicate zero force. Fiber length, 3.6 mm; average sarcomere length, 2.52 μm; CSA, 5740 μm2.
FIGURE 2
FIGURE 2
Protocol for stiffness measurement during isometric contraction at saturating [Ca2+] (A) and at a similar tension in rigor (B). (Upper traces) Sarcomere length change in nm hs−1. (Lower traces) Force. Horizontal lines are zero force. The same train of steps was imposed on the fiber in both activating and rigor solution. Force per CSA is expressed relative to the CSA in relaxing solution (4500 μm2). Fiber segment length, 2.3 mm; segment length under the striation follower, 0.87 mm. For active contraction, average segment sarcomere length, 2.60 μm; test temperature, 13.0°C. For rigor fiber, average segment sarcomere length, 2.50 μm; CSA, 4300 μm2; temperature, 13.0°C.
FIGURE 3
FIGURE 3
Equivalent myofilament compliance. (A) Superimposed length change per half-sarcomere (upper traces) and force response (lower traces) for steps of different size in a fiber activated at two pCas. (Upper) pCa 4.50; (lower) pCa 5.42. The horizontal line in each panel marks zero force. (B) T1 relations for three pCas. The relations are obtained by plotting the extreme tension attained at the end of the length step, T1 (relative to T0 at pCa = 4.50, T0,s), versus the step amplitude. Different symbols refer to different pCa values, as indicated in the inset. The lines are linear regressions fitted to the experimental points for each pCa. Fiber segment length, 3.88 mm; segment length under the striation follower, 1.08 mm; average sarcomere length, 2.58 μm; CSA, 4600 μm2; temperature, 12.1°C. (C) Relation of strain per half-sarcomere (Y0) against the isometric force at different pCa. Solid circles are the mean values (± SE) from five fibers grouped in classes of forces (from Table 2). The solid line is the linear regression on the pooled data (open circles).
FIGURE 4
FIGURE 4
Stiffness measurements in rigor at different steady forces and in active contraction at three temperatures. (A) Sample records of length changes per half-sarcomere (upper traces) and force responses (lower traces) in a fiber activated at saturating [Ca2+] (left column) and in rigor (right column) at a steady force, 0.91 T0,s. Same fiber as in Fig. 2. (B) T1 relations either during isometric contraction at saturating [Ca2+] (solid circles; T0,s = 175 kPa) or in rigor (open symbols) at different steady forces (squares, 0.53 T0,s; diamonds, 0.91 T0,s; triangles, 1.19 T0,s). The lines are linear regressions fitted to the experimental points. Isometric contraction, solid line; rigor, dashed lines. Same fiber as in Fig. 2. (C) T1 relations during isometric contraction at three temperatures (symbol key in the inset). Solid lines are linear regressions fitted to the experimental points at each temperature. Fiber-segment length, 3.55 mm; segment length under the striation follower, 0.95 mm; average sarcomere length, 2.58 μm; CSA, 4450 μm2.
FIGURE 5
FIGURE 5
Relation of half-sarcomere strain (Y0) versus steady force either in maximally Ca2+ activated fibers at different temperatures (solid circles) or in rigor (open circles). Mean ± SE of data grouped in classes of force. The lines are the linear regressions forced through zero fitted to the pooled data.
FIGURE 6
FIGURE 6
Relation of steady isometric force developed by maximally Ca2+-activated fibers versus the reciprocal of absolute temperature Θ. Circles are mean ± SE from Fig. 5. The line is the fit to the pooled data using the equation T0,θ = T0,max/(1 + exp(ΔH/(kb·Θ) − ΔS/kb)).
FIGURE 7
FIGURE 7
Effect of 4% dextran T-500 on half-sarcomere stiffness in the active isometric contraction and in rigor. (A) T1 relation in the isometric contraction at saturating Ca2+ (pCa, 4.50) either in the absence of dextran (solid circles) or in the presence of dextran (open symbols) at different pCa (circles, pCa 4.50; squares, pCa 6.00; triangles, pCa 6.25; inverted triangles, pCa 6.47). The lines are linear regressions fitted to the experimental points in the absence of dextran at pCa 4.50 (solid line) and in the presence of dextran at different pCa (dashed lines). Fiber segment length, 4.46 mm; segment length under the striation follower, 0.93 mm; average segment sarcomere length, 2.54 μm; CSA, 4540 μm2 in control and 3580 μm2 in the presence of dextran. Temperature, 11.7°C. (B) T1 relations in rigor in 4% dextran (open circles) and in control (solid symbols) before (circles) and after (diamonds) dextran. The lines are linear regressions fitted to the experimental points in control (solid lines) and in the presence of dextran (dashed lines). Fiber segment length, 2.70 mm; segment length under the striation follower, 0.83 mm; average segment sarcomere length, 2.53 μm; CSA, 4020 μm2 in relaxing solution in control, 3280 μm2 in rigor solution in control, and 2800 μm2 in rigor solution in the presence of dextran. Temperature, 11.8°C. (C) Relation of the half-sarcomere strain (Y0) against the isometric force at different pCa in dextran with the isometric force normalized for the CSA in the control solution (circles) and in the presence of dextran (squares). The solid circle represents the mean value (± SE) in control at saturating Ca2+ (pCa 4.50). The solid line is the linear regression on the data in control solution from Fig. 3. Dashed and dotted lines are linear regressions on the circles and squares, respectively. Data are from three fibers. Temperature, 11.8 ± 0.1°C.
FIGURE 8
FIGURE 8
Relation between hs stiffness and fraction of attached heads. Stiffness is normalized to the value with all heads attached (rigor). Points are calculated with two different values for the contribution of myosin heads to the hs compliance in rigor: 24%, control (open circles); 18%, 4% dextran (solid circles).

References

    1. Howard, J. 2001. Mechanics of Motor Protein and the Cytoskeleton. Sinauer, Sunderland, MA.
    1. Huxley, A. F. 1957. Muscle structure and theories of contraction. Prog. Biophys. Biophys. Chem. 7:255–318. - PubMed
    1. Ford, L. E., A. F. Huxley, and R. M. Simmons. 1985. Tension transients during steady shortening of frog muscle fibres. J. Physiol. 361:131–150. - PMC - PubMed
    1. Piazzesi, G., and V. Lombardi. 1995. A cross-bridge model that is able to explain mechanical and energetic properties of shortening muscle. Biophys. J. 68:1966–1979. - PMC - PubMed
    1. Huxley, A. F., and R. M. Simmons. 1971. Proposed mechanism of force generation in striated muscle. Nature. 233:533–538. - PubMed

Publication types

LinkOut - more resources