Kinesin moving through the spotlight: single-motor fluorescence microscopy with submillisecond time resolution
- PMID: 17237204
- PMCID: PMC1864830
- DOI: 10.1529/biophysj.106.093575
Kinesin moving through the spotlight: single-motor fluorescence microscopy with submillisecond time resolution
Abstract
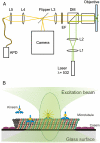
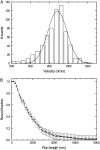
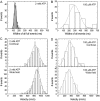
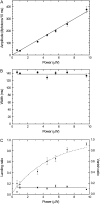
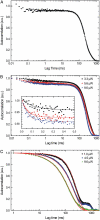
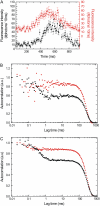
Kinesin-1 is one of the motor proteins that drive intracellular transport in eukaryotes. This motor makes hundreds of 8-nm steps along a microtubule before releasing. Kinesin-1 can move at velocities of up to approximately 800 nm/s, which means that one turnover on average takes 10 ms. Important details, however, concerning the coordination between the two motor domains have not been determined due to limitations of the techniques used. In this study, we present an approach that allows the observation of fluorescence intensity changes on individual kinesins with a time resolution far better than the duration of a single step. In our approach, the laser focus of a confocal fluorescence microscope is pointed at a microtubule and the photons emitted by fluorescently labeled kinesin motors walking through the spot are detected with submicrosecond accuracy. We show that the autocorrelation of a fluorescence time trace of an individual kinesin motor contains information at time lags down to 0.1 ms. The quality and time resolution of the autocorrelation is primarily determined by the amount of signal photons used. By adding the autocorrelations of several tens of kinesins, fluorescence intensity changes can be observed at a timescale below 100 micros.
Figures

Similar articles
-
Cooperative protofilament switching emerges from inter-motor interference in multiple-motor transport.Sci Rep. 2014 Dec 1;4:7255. doi: 10.1038/srep07255. Sci Rep. 2014. PMID: 25434968 Free PMC article.
-
Effect of the microtubule-associated protein tau on dynamics of single-headed motor proteins KIF1A.Phys Rev E Stat Nonlin Soft Matter Phys. 2014 Feb;89(2):022714. doi: 10.1103/PhysRevE.89.022714. Epub 2014 Feb 19. Phys Rev E Stat Nonlin Soft Matter Phys. 2014. PMID: 25353516
-
Traffic of single-headed motor proteins KIF1A: effects of lane changing.Phys Rev E Stat Nonlin Soft Matter Phys. 2008 May;77(5 Pt 1):050902. doi: 10.1103/PhysRevE.77.050902. Epub 2008 May 12. Phys Rev E Stat Nonlin Soft Matter Phys. 2008. PMID: 18643016
-
The structure of microtubule motor proteins.Adv Protein Chem. 2005;71:299-344. doi: 10.1016/S0065-3233(04)71008-6. Adv Protein Chem. 2005. PMID: 16230115 Review.
-
Collective dynamics of interacting molecular motors.Phys Rev Lett. 2006 Jul 21;97(3):038101. doi: 10.1103/PhysRevLett.97.038101. Epub 2006 Jul 19. Phys Rev Lett. 2006. PMID: 16907545 Review.
Cited by
-
Examining kinesin processivity within a general gating framework.Elife. 2015 Apr 22;4:e07403. doi: 10.7554/eLife.07403. Elife. 2015. PMID: 25902401 Free PMC article.
-
Mitochondrial motility and vascular smooth muscle proliferation.Arterioscler Thromb Vasc Biol. 2012 Dec;32(12):3000-11. doi: 10.1161/ATVBAHA.112.255174. Epub 2012 Oct 25. Arterioscler Thromb Vasc Biol. 2012. PMID: 23104850 Free PMC article.
-
Nonprocessive motor dynamics at the microtubule membrane tube interface.Biophys J. 2010 Jan 6;98(1):93-100. doi: 10.1016/j.bpj.2009.09.058. Biophys J. 2010. PMID: 20085722 Free PMC article.
-
Structure and dynamics of the kinesin-microtubule interaction revealed by fluorescence polarization microscopy.Methods Cell Biol. 2010;95:505-19. doi: 10.1016/S0091-679X(10)95025-5. Methods Cell Biol. 2010. PMID: 20466150 Free PMC article. Review.
-
Kinesin recycling in stationary membrane tubes.Biophys J. 2010 Sep 22;99(6):1835-41. doi: 10.1016/j.bpj.2010.06.071. Biophys J. 2010. PMID: 20858428 Free PMC article.
References
-
- Svoboda, K., C. F. Schmidt, B. J. Schnapp, and S. M. Block. 1993. Direct observation of kinesin stepping by optical trapping interferometry. Nature. 365:721–727. - PubMed
-
- Schnitzer, M. J., and S. M. Block. 1997. Kinesin hydrolyses one ATP per 8-nm step. Nature. 388:386–390. - PubMed
-
- Carter, N. J., and R. A. Cross. 2006. Kinesin's moonwalk. Curr. Opin. Cell Biol. 18:61–67. - PubMed
-
- Visscher, K., M. J. Schnitzer, and S. M. Block. 1999. Single kinesin molecules studied with a molecular force clamp. Nature. 400:184–189. - PubMed
Publication types
MeSH terms
Substances
LinkOut - more resources
Full Text Sources

