

Regulatory network construction in Arabidopsis by using genome-wide gene expression quantitative trait loci
- PMID: 17237218
- PMCID: PMC1785256
- DOI: 10.1073/pnas.0610429104
Regulatory network construction in Arabidopsis by using genome-wide gene expression quantitative trait loci
Abstract
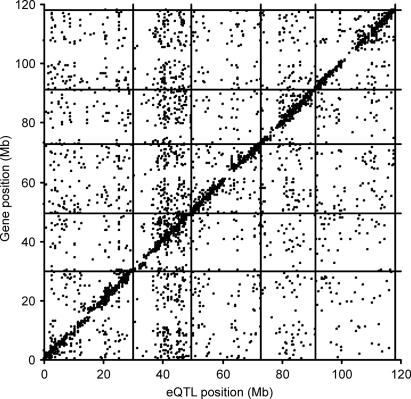
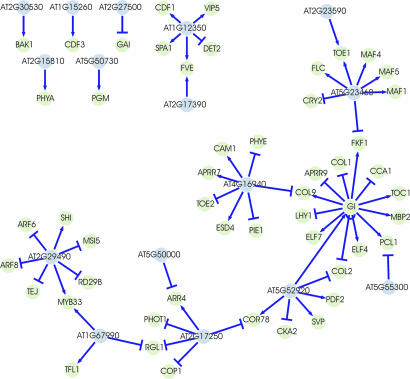
Accessions of a plant species can show considerable genetic differences that are analyzed effectively by using recombinant inbred line (RIL) populations. Here we describe the results of genome-wide expression variation analysis in an RIL population of Arabidopsis thaliana. For many genes, variation in expression could be explained by expression quantitative trait loci (eQTLs). The nature and consequences of this variation are discussed based on additional genetic parameters, such as heritability and transgression and by examining the genomic position of eQTLs versus gene position, polymorphism frequency, and gene ontology. Furthermore, we developed an approach for genetic regulatory network construction by combining eQTL mapping and regulator candidate gene selection. The power of our method was shown in a case study of genes associated with flowering time, a well studied regulatory network in Arabidopsis. Results that revealed clusters of coregulated genes and their most likely regulators were in agreement with published data, and unknown relationships could be predicted.
Conflict of interest statement
The authors declare no conflict of interest.
Figures
References
Publication types
MeSH terms
Substances
LinkOut - more resources
Full Text Sources
Other Literature Sources
