. 2007 Jan 30;104(5):1685-90.
doi: 10.1073/pnas.0609318104. Epub 2007 Jan 19.

Corticothalamic feedback enhances stimulus response precision in the visual system

Affiliations

Corticothalamic feedback enhances stimulus response precision in the visual system

Ian M Andolina et al. Proc Natl Acad Sci U S A. .

Abstract

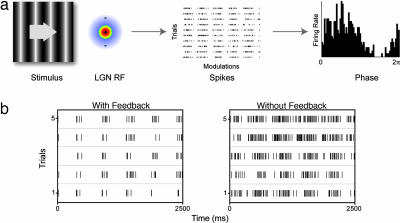
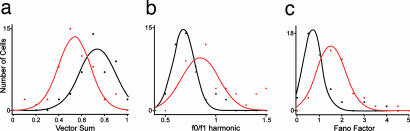
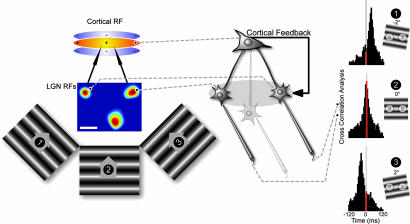
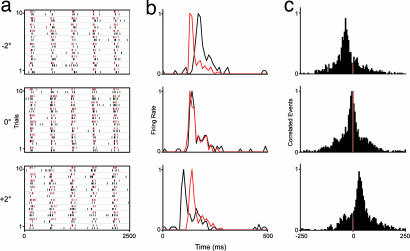
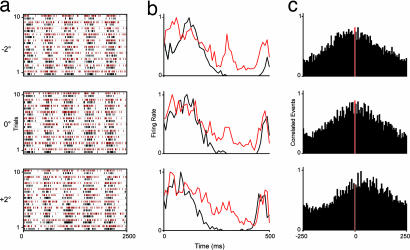
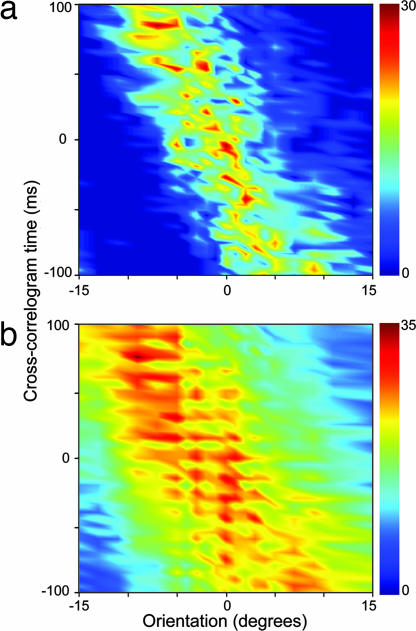
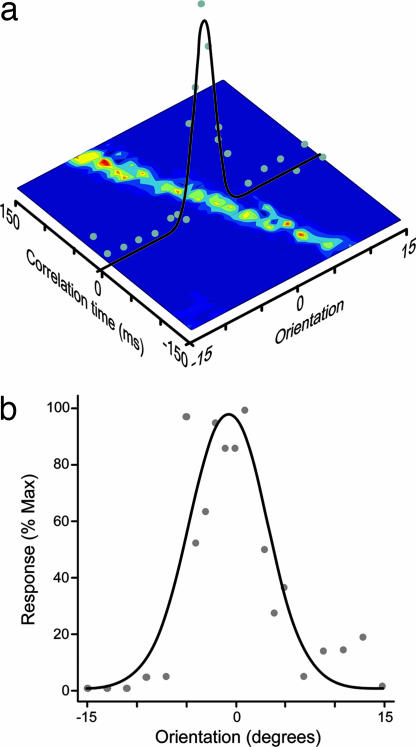
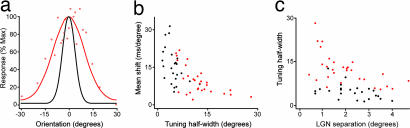
There is a tightly coupled bidirectional interaction between visual cortex and visual thalamus [lateral geniculate nucleus (LGN)]. Using drifting sinusoidal grating stimuli, we compared the response of cells in the LGN with and without feedback from the visual cortex. Raster plots revealed a striking difference in the response pattern of cells with and without feedback. This difference was reflected in the results from computing vector sum plots and the ratio of zero harmonic to the fundamental harmonic of the fast Fourier transform (FFT) for these responses. The variability of responses assessed by using the Fano factor was also different for the two groups, with the cells without feedback showing higher variability. We examined the covariance of these measures between pairs of simultaneously recorded cells with and without feedback, and they were much more strongly positively correlated with feedback. We constructed orientation tuning curves from the central 5 ms in the raw cross-correlograms of the outputs of pairs of LGN cells, and these curves revealed much sharper tuning with feedback. We discuss the significance of these data for cortical function and suggest that the precision in stimulus-linked firing in the LGN appears as an emergent factor from the corticothalamic interaction.


Conflict of interest statement

The authors declare no conflict of interest.

Figures

Fig. 1.
Fig. 1.
Experimental paradigm. (a) Responses to drifting gratings were analyzed for response structure and reliability. Example raster and resultant phase plots are derived from a modulated Poisson spiking model. (b) Data raster plots for a cell with (Left) and without (Right) cortical feedback.
Fig. 2.
Fig. 2.
Gaussian fitted population histograms. Distributions were highly significantly different between control (black) and feedback removed (red) samples for vector sum (a), Fourier ratio (b), and Fano factor (c) (P < 0.001; Kolmogorov–Smirnov two-sample test).
Fig. 3.
Fig. 3.
Raw cross-correlograms were calculated from the responses of simultaneously recorded LGN cells to drifting gratings of varying orientation. (Left and Center) Stimulus configuration and example receptive field plots (scale bar 1°). (Right) Cross-correlograms from a pair of LGN cells recorded in the presence of cortical feedback for three orientations (−2°, 0°, +2°). Shift in correlogram peak with stimulus angle, 15.4 ms/°. Red shading highlights a 5-ms window centered at zero lag.
Fig. 4.
Fig. 4.
Responses of a pair of control LGN cells to three grating orientations (−2°, 0°, +2°). Shown are raster plots (a), normalized PSTHs (b), and normalized cross-correlograms (500-ms window; y axis, normalized correlated events) (c). In a and b, red and black differentiate responses of the two cells. Grating contrast 0.36, spatial frequency 0.66 cycles/°, temporal frequency 2 Hz, 10 trials, five stimulus modulations.
Fig. 5.
Fig. 5.
Responses of a pair of LGN cells without feedback. Shown are raster plots (a), normalized PSTHs (b), and normalized cross-correlograms (c). Conventions and stimulus details are as in Fig. 4.
Fig. 6.
Fig. 6.
Surface plots of cross-correlogram data (y axis) versus orientation (x axis, degrees) for pairs of LGN cells recorded with (a) and without (b) cortical feedback. Color scale, number of raw correlated events. Stimulus details are as in Fig. 4. (a) Receptive field (RF) separation = 1.8°; mean correlogram shift = 14.6 ms/°. (b) RF separation = 2.3°; mean shift = 9.9ms/°.
Fig. 7.
Fig. 7.
Tuning curves for orientation selectivity derived from the correlated spikes. (a) Schematic detailing how the tuning curves were constructed via the surface representations. (b) Tuning curve derived from a 5-ms integration window from a control cell pair (same pair as Fig. 6a), tuning half-width 4.1°, which was close to the mean of the control data (4.7° ± 0.52 SE).
Fig. 8.
Fig. 8.
Effects of removing cortical feedback. (a) Red tuning curve derived from a 5-ms integration window for a cell pair without feedback (same pair as Fig. 6b), tuning half-width 13.0°, which was close to the mean of the data for the cells without feedback (12.2° ± 0.99). For comparison, the tuning curve of the control cell pair shown in Fig. 7b is replotted on the same axes. (b) Scatter plot of tuning half-width versus mean shift of cross-correlogram peak with orientation. Control data are black, and feedback removed data are red. (c) Scatter plot of tuning half-width versus LGN cell center-to-center separation.

Similar articles

Cited by

References

    1. Rieke F, Warland DK, van Steveninck RdR, Bialek W. Spikes: Exploring the Neural Code. Cambridge, MA: MIT Press; 1996.
    1. Usrey WM, Reid RC. Annu Rev Physiol. 1999;61:435–456. - PubMed
    1. Sherman SM. Prog Brain Res. 2005;149:107–126. - PubMed
    1. Bruno RM, Sakmann B. Science. 2006;312:1622–1627. - PubMed
    1. Roy SA, Alloway KD. J Neurosci. 2001;21:2462–2473. - PMC - PubMed

Publication types