. 2007 Jan;19(1):148-62.
doi: 10.1105/tpc.106.044495. Epub 2007 Jan 19.

Flavonoid accumulation in Arabidopsis repressed in lignin synthesis affects auxin transport and plant growth

Affiliations

Flavonoid accumulation in Arabidopsis repressed in lignin synthesis affects auxin transport and plant growth

Sébastien Besseau et al. Plant Cell. 2007 Jan.

Abstract

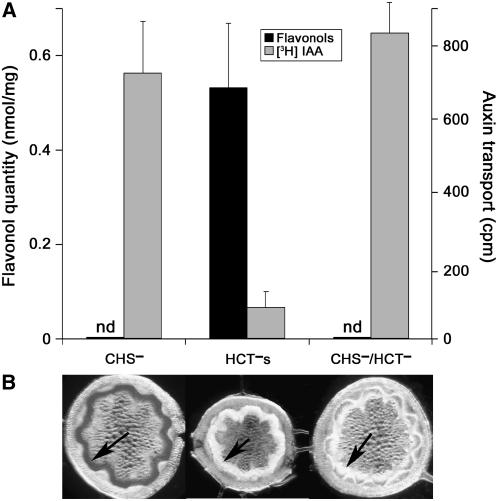
In Arabidopsis thaliana, silencing of hydroxycinnamoyl-CoA shikimate/quinate hydroxycinnamoyl transferase (HCT), a lignin biosynthetic gene, results in a strong reduction of plant growth. We show that, in HCT-silenced plants, lignin synthesis repression leads to the redirection of the metabolic flux into flavonoids through chalcone synthase activity. Several flavonol glycosides and acylated anthocyanin were shown to accumulate in higher amounts in silenced plants. By contrast, sinapoylmalate levels were barely affected, suggesting that the synthesis of that phenylpropanoid compound might be HCT-independent. The growth phenotype of HCT-silenced plants was shown to be controlled by light and to depend on chalcone synthase expression. Histochemical analysis of silenced stem tissues demonstrated altered tracheary elements. The level of plant growth reduction of HCT-deficient plants was correlated with the inhibition of auxin transport. Suppression of flavonoid accumulation by chalcone synthase repression in HCT-deficient plants restored normal auxin transport and wild-type plant growth. By contrast, the lignin structure of the plants simultaneously repressed for HCT and chalcone synthase remained as severely altered as in HCT-silenced plants, with a large predominance of nonmethoxylated H units. These data demonstrate that the reduced size phenotype of HCT-silenced plants is not due to the alteration of lignin synthesis but to flavonoid accumulation.


Figures

Figure 1.
Figure 1.
The Phenylpropanoid Pathway. P-coumaroyl CoA is at the crossroad of metabolic routes leading either to flavonoids or to monolignols and sinapoylmalate. CHS and HCT activities control the metabolic flux entering the two routes. ALDH, aldehyde dehydrogenase; C3H, C3-hydroxylase (CYP98A3); C4H, C4-hydroxylase (CYP73A5); F5H, ferulate 5-hydroxylase (CYP84A1); CAD, cinnamyl alcohol dehydrogenase; CCoAOMT, caffeoyl-CoA O-methyltransferase; CCR, cinnamoyl-CoA reductase; CHI, chalcone isomerase; 4CL, 4-coumaroyl-CoA ligase; COMT I, caffeic acid O-methyltransferase of class I; F3H, flavanone 3-hydroxylase; F3′H, flavonoid 3′-hydroxylase (CYP75B1); FLS, flavonol synthase; PAL, phenylalanine ammonia lyase; SGT, sinapate UDP-glucose sinapoyltransferase; SMT, sinapoylglucose malate sinapoyltransferase; UGTs, UDP sugar glycosyltransferases.
Figure 2.
Figure 2.
HCT Silencing Has a Strong Impact on Plant Growth. (A) Three typical size phenotypes (i, intermediate; s, small; vs, very small) were observed among T1 progeny of transformants carrying an HCT hairpin repeat (right-hand plants) compared with the wild-type control plant (on the left). (B) Protein extracts from wild-type stems or stems of plant types i and s or leaves of plant vs were immunoblotted with a specific anti-HCT serum raised against the Arabidopsis protein. The arrow indicates the position of HCT protein. At the right is the position of markers of known molecular mass (given in kilodaltons). (C) HCT activity was strongly reduced in plants of small size phenotypes (i, s, and vs) compared with the wild type. Mean activity values and standard errors were calculated from four determinations.
Figure 3.
Figure 3.
HPLC and Liquid Chromatography–Mass Spectrometry Analysis of Soluble Phenolics Extracted from Wild-Type or HCT-Deficient Leaf Tissues. (A) and (B) Profiles of wild-type extracts at 345 and 530 nm, respectively. SM, sinapoylmalate. (C) and (D) Profiles of HCT-silenced extracts at 345 and 530 nm, respectively. (E) to (H) Examples of electrospray mass spectra (K1, C4, Q2, and C5 peaks, respectively) used for structure determination by comparison with published data (Table 1, Figure 4). Electrospray mass spectra of K1 and Q2 were obtained in the negative mode and C4 and C5 spectra in the positive mode. m/z, mass-to-charge ratio.
Figure 4.
Figure 4.
Flavonoids Accumulated in HCT-Deficient Arabidopsis. Structure of flavonol glycosides and cyanidin derivatives were inferred from their UV-visible and mass spectral properties (Table 1) and from available data (Graham, 1998; Veit and Pauli, 1999; Bloor and Abrahams, 2002; Jones et al., 2003; Abdulrazzak et al., 2005; Tohge et al., 2005).
Figure 5.
Figure 5.
Light Controls the Plant Growth Phenotypes. Wild-type, HCT-deficient (HCTi and HCTs) and CHS-deficient (CHS) plants were cultivated under different light intensities. (A), (C), (E), and (G) Thirty-day-old plants grown under standard light conditions (70 μmol·m2·s−1). (B), (D), (F), and (H) Forty-five-day-old plants grown under low light conditions (20 μmol·m2·s−1).
Figure 6.
Figure 6.
Effect of Light Stress on CHS Expression and Phenolic Content of Wild-Type, CHS, and HCT Plants. Plants were submitted to light stress (190 μmol·m2 ·s−1) after 45 d of cultivation under low light conditions (20 μmol·m2·s−1). The leaves were extracted at 0-, 32-, and 54-h time points and analyzed by RNA gel blot using a CHS cDNA probe (A) or by HPLC to evaluate flavonoid (B) or sinapoylmalate (C) content. In (A), the position of CHS mRNA is indicated at the left. Flavonoid levels were estimated by adding the amounts of flavonol and anthocyanin derivatives separated by HPLC as illustrated in Figure 3. Mean values and standard errors were calculated from five to seven determinations. nd, not detected.
Figure 7.
Figure 7.
Comparison of Flavonoid Levels and Auxin Transport Values in Wild-Type, CHS, and HCT Plants. (A) Plants used for experiments. (B) Auxin transport was evaluated by measuring the radioactivity of stem segments of the plants after feeding of tritiated indole-3-acetic acid (see Methods for details) alone or in the presence of 1 μM NPA. Total flavonol quantities extracted from stems were calculated by adding the amounts of the different flavonol glycosides separated by HPLC as in Figure 3. Mean values and standard errors were calculated from five samples for auxin transport measurements in the absence of NPA and five to seven samples for flavonoid analysis. When auxin transport measurements were performed in the presence of NPA, similar values were obtained in two experiments.
Figure 8.
Figure 8.
Histochemical Analysis of the Effects of HCT Silencing on Stem Structure and Lignin. Sections of stems from wild-type, CHS, HCTI, and HCTs plants were stained with Wiesner reagent to detect lignin ([A], [E], [I], and [M]), Mäule reagent to detect S lignin unit ([B], [F], [J], and [N]), or toluidine blue to stain cell walls ([C], [D], [G], [H], [K], [L], [O], and [P]). Arrows show the zones that are scaled up in the insets. cb, cambium; co, cortex; epd, epidermis; if, interfascicular fiber; ph, phloem; pi, pith; xy, xylem. Bars = 100 or 300 μm as indicated.
Figure 9.
Figure 9.
Analysis of the Crosses between HCT Plants and Wild-Type or CHS Plants. (A) Progeny and parent phenotypes of HCT × wild type cross; half of the progeny displayed the same growth phenotype as the HCT parent. (B) HCT expression in the progeny of HCT × wild type cross was analyzed by immunoblotting stem extracts with anti-HCT antibodies; progeny of small size did not express HCT, whereas progeny of the wild-type size did. Four representative samples are shown in each case. (C) Progeny and parent phenotypes of the HCT × CHS cross; all the progeny was of the wild-type size. (D) HCT expression analysis in the progeny of HCT × CHS cross by immunoblotting of stem extracts; four extracts (out of seven) that displayed no signal are shown together with four typical positive signals (out of six).
Figure 10.
Figure 10.
Suppression of Flavonoid Accumulation in CHS/HCT Plants Restored Normal Auxin Transport and Growth. (A) Auxin transport and flavonol content in stems of CHS/HCT progeny were compared with those of CHS and HCT parents. Mean values and standard errors were calculated from five to seven determinations. nd, not detected. (B) The lack of Mäule staining observed in stem sections of CHS/HCT progeny and the HCT parent points to a low content in S lignin unit. Arrows indicate tissues that stained red only in the CHS section.

Similar articles

Cited by

References

    1. Abdulrazzak, N., et al. (2005). A coumaroyl-ester-3-hydroxylase insertion mutant reveals the existence of nonredundant meta-hydroxylation pathways and essential roles for phenolic precursors in cell expansion and plant growth. Plant Physiol. 140 30–48. - PMC - PubMed
    1. Atanassova, R., Favet, N., Martz, F., Chabbert, B., Thollier, M.T., Monties, B., Fritig, B., and Legrand, M. (1995). Altered lignin composition in transgenic tobacco expressing O-methyltransferase sequences in sense and antisense orientation. Plant J. 8 465–477.
    1. Benjamins, R., Quint, A., Weijers, D., Hooykaas, P., and Offringa, R. (2001). The PINOID protein kinase regulates organ development in Arabidopsis by enhancing polar auxin transport. Development 128 4057–4067. - PubMed
    1. Berleth, T., Mattsson, J., and Hardtke, C.S. (2000). Vascular continuity and auxin signals. Trends Plant Sci. 5 387–393. - PubMed
    1. Blakeslee, J.J., Peer, W.A., and Murphy, A.S. (2005). Auxin transport. Curr. Opin. Plant Biol. 8 494–500. - PubMed

Publication types

MeSH terms