. 2007 Feb;10(2):186-95.
doi: 10.1038/nn1837. Epub 2007 Jan 21.

Retrograde modulation of presynaptic release probability through signaling mediated by PSD-95-neuroligin

Affiliations

Retrograde modulation of presynaptic release probability through signaling mediated by PSD-95-neuroligin

Kensuke Futai et al. Nat Neurosci. 2007 Feb.

Erratum in

  • Nat Neurosci. 2008 Feb;11(2):238

Abstract

The structure and function of presynaptic and postsynaptic components of the synapse are highly coordinated. How such coordination is achieved and the molecules involved in this process have not been clarified. Several lines of evidence suggest that presynaptic functionalities are regulated by retrograde mechanisms from the postsynaptic side. We therefore sought postsynaptic mechanisms responsible for trans-synaptic regulation of presynaptic function at excitatory synapses in rat hippocampal CA1 pyramidal neurons. We show here that the postsynaptic complex of scaffolding protein PSD-95 and neuroligin can modulate the release probability of transmitter vesicles at synapse in a retrograde way, resulting in altered presynaptic short-term plasticity. Presynaptic beta-neurexin serves as a likely presynaptic mediator of this effect. Our results indicate that trans-synaptic protein-protein interactions can link postsynaptic and presynaptic function.


Figures
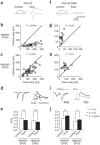
Figure 1
Figure 1
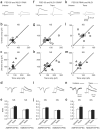
Effect of postsynaptic PSD-95 on synaptic transmission. Effect of overexpression (ae) or downregulation (fj) of PSD-95 on excitatory synaptic transmission in hippocampal CA1 pyramidal cells. Expression vectors for PSD-95 or short hairpin RNA directed against PSD-95 were transfected together with pEGFP-C1 at a ratio of 9:1 by weight. PDS-95 was assayed 3 d after transfection; RNAi, after 5 d. An empty pSuper vector used for negative control of RNAi did not show any substantial change in amplitude or PPR (data not shown). (a,f) Sample EPSC traces mediated by the AMPAR (downward) and NMDAR (upward) from pairs of transfected neurons (Trans) and neighboring untransfected neurons (Untrans). Stimulus artifacts were truncated. (b,c,g,h) EPSC amplitude (amp) for each pair of transfected and neighboring untransfected cells (open symbols); filled symbols indicate the mean. Number of cell pairs: PSD-95, 31 and 42; RNAi, 11 and 10 (for AMPAR-EPSC and NMDAR-EPSC, respectively). (d,i) Sample traces of PPR of AMPAR (left) and NMDAR (right) EPSC. EPSCs normalized to the first EPSC amplitude from transfected neurons (gray) and untransfected neurons (black) are superimposed. Because the first NMDAR-EPSC overlaps with the second EPSC, to measure accurate amplitude of the second EPSC, we ‘cancelled’ the first EPSC by subtracting the traces receiving a single pulse from those receiving a paired pulse, both normalized to the first response. (e,j) Summary graphs of PPR. The PPR was calculated by dividing the average amplitude of the second EPSC by that of the first EPSC. Number of cell pairs: PSD-95, 30 and 27; PSD-95 RNAi, 11 and 10 for AMPA and NMDAR-EPSC, respectively. Error bars, s.e.m. (for all figures).
Figure 2
Figure 2
Postsynaptic PSD-95 regulates release probability in a retrograde way. MK-801, an open channel blocker for NMDA receptor, was used to estimate the presynaptic release probability in hippocampal CA1 pyramidal cells overexpressing PSD-95 (ac) or expressing short hairpin RNA directed against PSD-95 (df). (a,d) Sample traces of NMDAR-EPSCs recorded in the presence of MK-801. Key indicates stimulus sequence numbers included in the averaged traces. The first pulse given in the presence of MK-801 (40 μM) was considered 1. (b,e) Average NMDAR-EPSC amplitude during MK-801 perfusion across multiple cells. Amplitudes are the average of each five consecutive EPSCs normalized to that of the first averaged EPSC recorded in the presence of MK-801 in each experiment. Average amplitudes were fitted with single-exponential functions. (c,f) Summary of the effect of MK-801. Data represent the τ value calculated in each experiment for untransfected and transfected neurons. Decay constant (in number of stimuli): PSD-95-transfected cells, 43.1 ± 1.9, and untransfected cells, 59.8 ± 4.9 (16 cell pairs); PSD-95 RNAi–treated cells, 51.7 ± 2.9, and untreated cells, 41.1 ± 3.2 (11 cell pairs). The difference of the decay constant of two untransfected cell groups may be attributable to the different experimental setups and batches of drugs used.
Figure 3
Figure 3
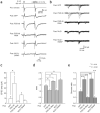
Postsynaptic PSD-95 changes presynaptic sensitivity to extracellular Ca2+. Pairs of neurons, one transfected with PSD-95 and the other untransfected were recorded simultaneously. (ac) NMDAR-EPSC amplitudes at various concentrations of extracellular Ca2+ ([Ca2+]out). (a) Sample NMDAR-EPSC traces for pairs of transfected neurons (gray) and neighboring untransfected neurons (black) at five different extracellular Ca2+ concentrations. All traces are from the same pair of neurons In the presence of 4 mM Mg2+ and 1 μM 2-chloroadenosine. (b) Summary of the relationship between extracellular Ca2+ concentration and NMDAR-EPSC amplitude. EPSCs were normalized to the EPSC amplitude at 4 mM Ca2+ for transfected cells (gray) and untransfected cells (black). The Ca2+-release relationship for transfected and untransfected cells was fitted to a sigmoidal curve. Number of cell pairs: 1 mM Ca2+, 7; 2 mM Ca2+, 15; 3 mM Ca2+, 13; 4 mM Ca2+, 19; 10 mM Ca2+, 15. (c) Ratio of amplitude from neurons transfected with PSD-95 to that from untransfected cells. (d,e) Increase in cleft concentration of the low-affinity antagonist for AMPAR γ-DGG in neurons expressing PSD-95. (d) Top, superimposed sample traces of AMPAR-EPSC with or without γ-DGG; bottom, superimposed sample traces normalized to the peak amplitude of the traces before the application of γ-DGG. *, polysynaptic EPSCs. (e) Summary of remaining fraction of EPSC after the application of γ-DGG. Number of cell pairs = 9.
Figure 4
Figure 4
Effect of postsynaptic NLG1 on synaptic transmission. Effect of overexpression of NLG1 (ae) or of NLG1 downregulation by RNAi (fj) or with the dominant negative form NLG1-SWAP (ko). Test constructs were transfected together with pEGFP-C1 at a ratio of 9:1. Experiments with NLG1 were assayed 3–4 d after transfection; those with RNAi and NLG1-SWAP, after 4–5 d. (a,f,k) Sample EPSC traces. (b,c,g,h,l,m) Plots of AMPAR-EPSC amplitudes (b,g,l) and NMDAR-EPSC amplitudes (c,h,m). Number of cell pairs: NLG1, 9 and 9; NLG1 RNAi, 8 and 8; NLG1-SWAP, 22 and 19 for AMPA and NMDAR-EPSC, respectively. (d,i,n) Normalized sample trace of the PPR of the AMPAR-EPSC (left) and NMDAR-EPSC (right). (e,j,o) Summary of PPRs. Number of cell pairs: NLG1, 9 and 9; NLG1 RNAi, 8 and 8; NLG1-SWAP, 22 and 19. NS, not significant. See Figure 1 for other details.
Figure 5
Figure 5
Interactions between PSD-95 and NLG1 are necessary for both the pre- and postsynaptic effect. Blockade of the effect of PSD-95 with NLG1-RNAi (ae) or NLG1-SWAP (fj) and of NLG1 with PSD-95-RNAi (ko). In ae, we cotransfected expression vectors for PSD-95, NLG1 shRNA and pEGFP-C1; in fj, expression vectors for PSD-95, NLG1-SWAP and pEGFP-C1; in ko, expression vectors for NLG1, PSD-95 shRNA and pEGFP-C1, at a ratio of 9:9:2 or 3:6:1 by weight of the DNA constructs. Because results were similar at different ratios, they are combined. Empty RNAi vector (pSuper) did not block the effect of NLG1 (data not shown). Cells were assayed 3–4 d after transfection. (a,f,k) Sample EPSC traces. (b,c,g,h,l,m) Plots of AMPAR-EPSC amplitudes (b,g,l) and NMDAR-EPSC amplitudes (c,h,m). (d,i,n) Normalized sample traces of the PPR of the AMPAR-EPSC (left) and NMDAR-EPSC (right). (e,j,o) Summary of PPRs. Number of cell pairs: PSD-95 and NLG1 RNAi, 8 and 8; PSD-95 and NLG1-SWAP, 14 and 14; PSD-95 RNAi and NLG1, 7 and 7. See Figure 1 for other details.
Figure 6
Figure 6
Postsynaptic PSD-95 and NLG regulates the release probability in a retrograde way in CA3–CA3 pyramidal cell synapses. Cells were transfected with PSD-95 and or were treated with PSD-95 RNAi and were analyzed as described in Figure 1. NLG1 and NLG1-SWAP were transfected and analyzed, as described in Figure 4. Controls are neuronal pairs expressing GFP postsynaptically. NLG1-SWAP, pGW1 empty vector and pEGFP-C1 were transfected together at a ratio of 9:9:2. Pre, presynaptic; Post, postsynaptic. (a) Averaged sample AMPAR-EPSC traces (bottom traces) induced by two presynaptically applied depolarization commands (top). Second from top, presynaptic action current. (b) Ten consecutive AMPAR-EPSC traces, superimposed. The heterogeneity in amplitude for a single pair is probably because more than one connection is often made between a pair of CA3 cells. Alternatively, it may be due to a difference in the number of released vesicles. (ce) Summary of AMPAR-EPSC amplitude (c), AMPAR-PPR (d) and success rate of synaptic transmission (e). Number of cell pairs used for recording: PSD-95, 25; PSD-95 RNAi, 10; NLG1, 12; NLG1-SWAP, 8; GFP, 13. Pairs of neurons found to be synaptically connected: postsynaptic GFP expression, 28.9%; postsynaptic PSD-95-transfected pairs, 35.7%; PSD-95 RNAi, 15%; NLG1, 76.5%; NLG1-SWAP, 14.3%.
Figure 7
Figure 7
Reducing presynaptic βNrxn function decreases the release probability. The effect of presynaptic overexpression of βNrxn or βNrxnΔC. The expression vectors for βNrxn or βNrxnΔC were cotransfected with empty pGW1 and pEGFP-C1 at a ratio of 1:2:2 by weight of the DNA constructs; cells were assayed 1–2 d after transfection. Presynaptic neurons transfected with GFP were used as controls. (a,b) Averaged (a) and superimposed (b) sample AMPAR-EPSC traces. (ce) Summary of AMPAR-EPSC amplitude (c), AMPAR PPR (d) and success ratio of synaptic transmission (e). Number of neurons: βNrxn, 12; βNrxnΔC, 10. Pairs of neurons found to be synaptically connected: presynaptic GFP expression, 22.2%; presynaptic βNrxnΔC expression, 29.3%; presynaptic βNrxn transfection, 22.0%.

Similar articles

Cited by

References

    1. Liu G, Choi S, Tsien RW. Variability of neurotransmitter concentration and nonsaturation of postsynaptic AMPA receptors at synapses in hippocampal cultures and slices. Neuron. 1999;22:395–409. - PubMed
    1. Dobrunz LE, Stevens CF. Heterogeneity of release probability, facilitation, and depletion at central synapses. Neuron. 1997;18:995–1008. - PubMed
    1. Rosenmund C, Clements JD, Westbrook GL. Nonuniform probability of glutamate release at a hippocampal synapse. Science. 1993;262:754–757. - PubMed
    1. Conti R, Lisman J. The high variance of AMPA receptor- and NMDA receptor-mediated responses at single hippocampal synapses: evidence for multiquantal release. Proc Natl Acad Sci USA. 2003;100:4885–4890. - PMC - PubMed
    1. Matsuzaki M, et al. Dendritic spine geometry is critical for AMPA receptor expression in hippocampal CA1 pyramidal neurons. Nat Neurosci. 2001;4:1086–1092. - PMC - PubMed

Publication types

MeSH terms