. 2007 Feb;39(2):189-98.
doi: 10.1038/ng1928. Epub 2007 Jan 21.

PTEN-deficient intestinal stem cells initiate intestinal polyposis

Affiliations

PTEN-deficient intestinal stem cells initiate intestinal polyposis

Xi C He et al. Nat Genet. 2007 Feb.

Abstract

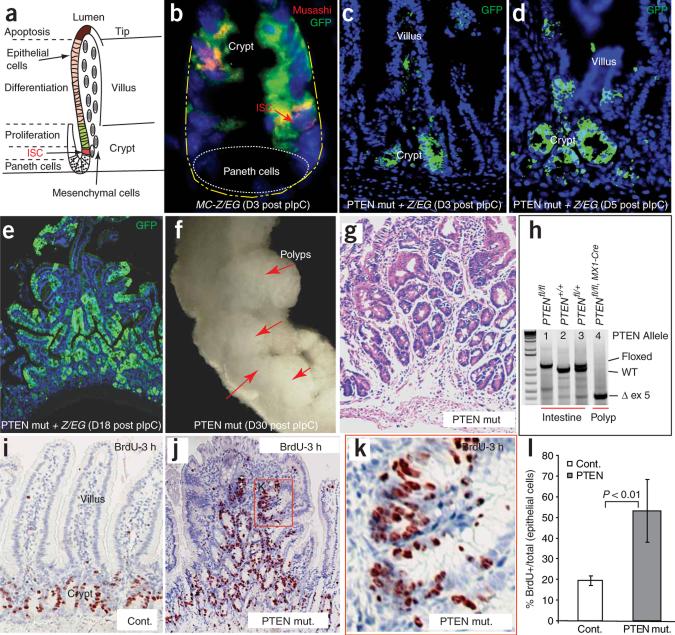
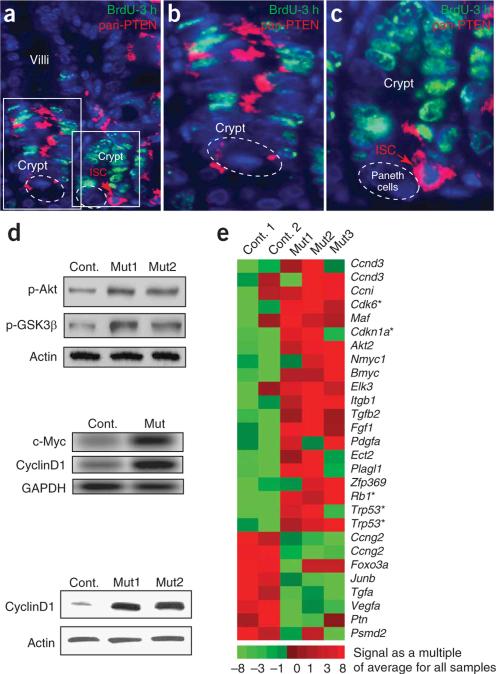
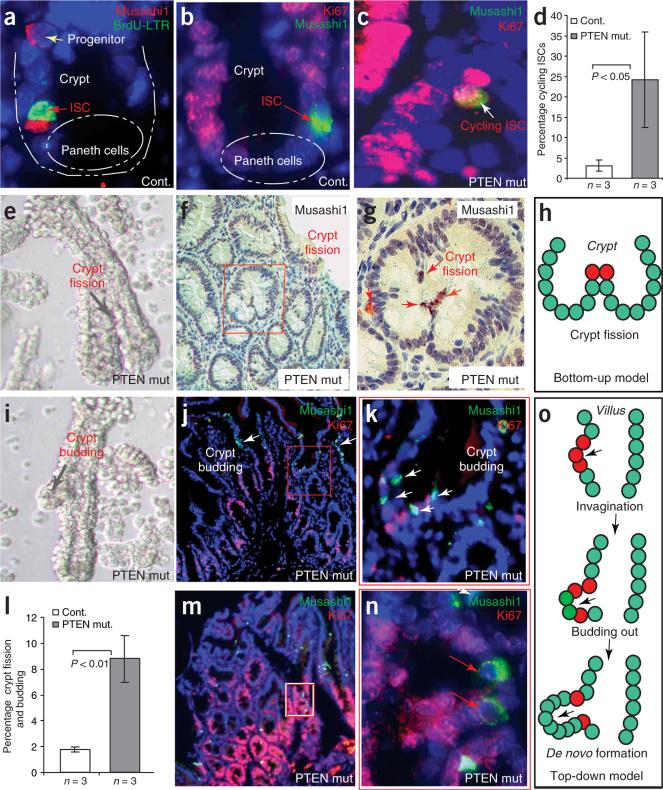
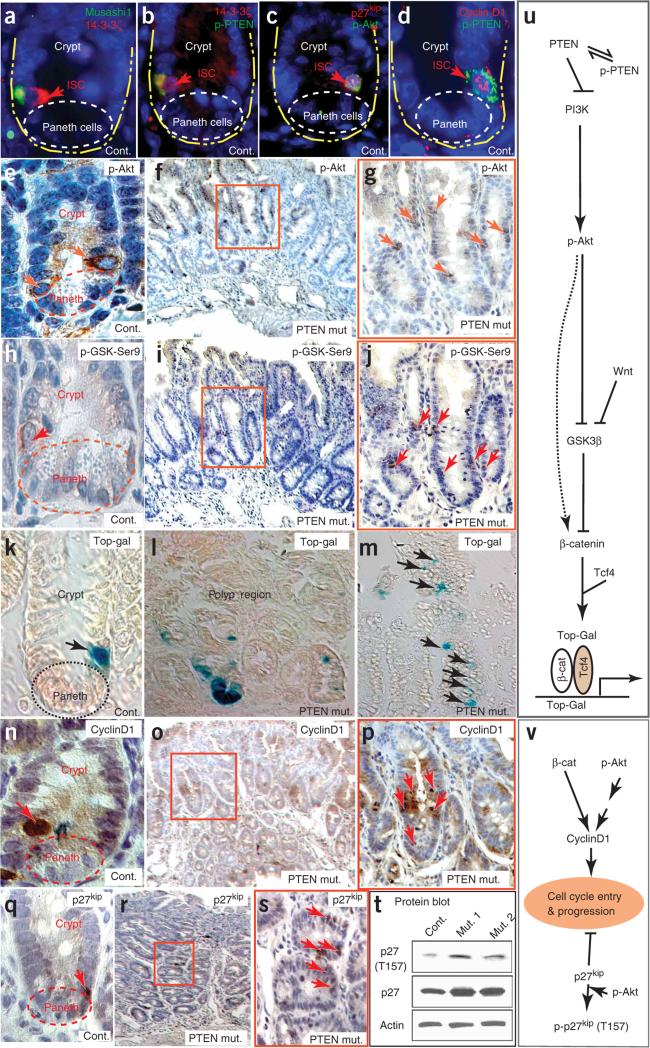
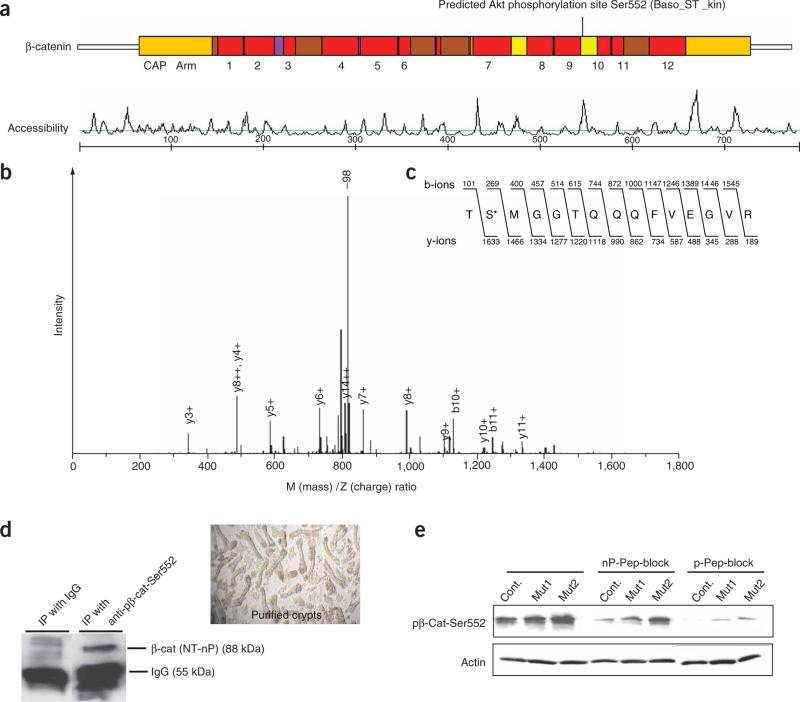
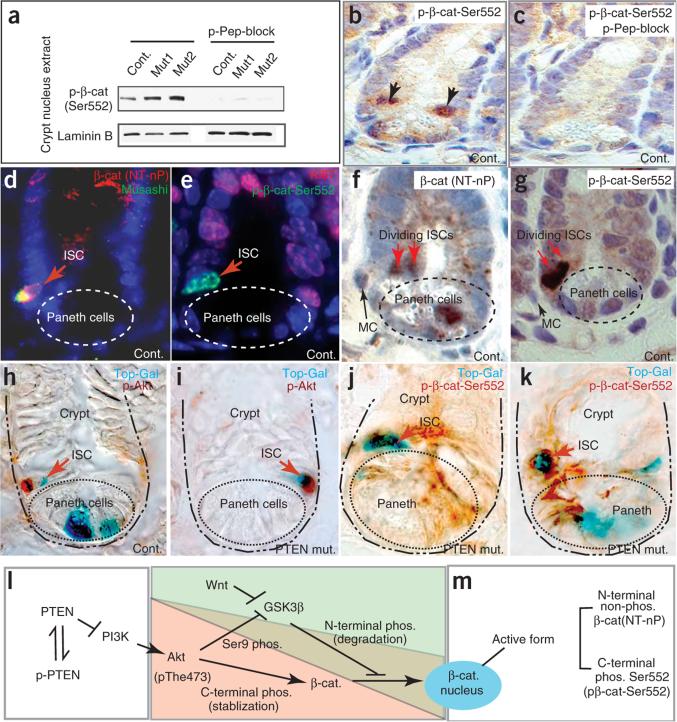
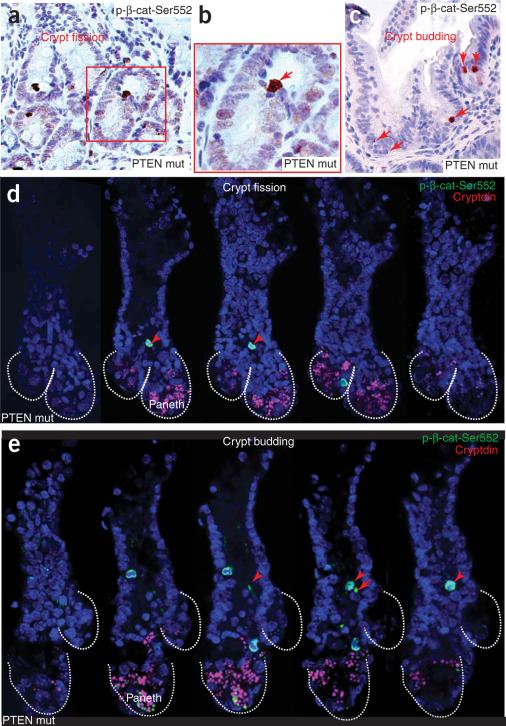
Intestinal polyposis, a precancerous neoplasia, results primarily from an abnormal increase in the number of crypts, which contain intestinal stem cells (ISCs). In mice, widespread deletion of the tumor suppressor Phosphatase and tensin homolog (PTEN) generates hamartomatous intestinal polyps with epithelial and stromal involvement. Using this model, we have established the relationship between stem cells and polyp and tumor formation. PTEN helps govern the proliferation rate and number of ISCs and loss of PTEN results in an excess of ISCs. In PTEN-deficient mice, excess ISCs initiate de novo crypt formation and crypt fission, recapitulating crypt production in fetal and neonatal intestine. The PTEN-Akt pathway probably governs stem cell activation by helping control nuclear localization of the Wnt pathway effector beta-catenin. Akt phosphorylates beta-catenin at Ser552, resulting in a nuclear-localized form in ISCs. Our observations show that intestinal polyposis is initiated by PTEN-deficient ISCs that undergo excessive proliferation driven by Akt activation and nuclear localization of beta-catenin.


Figures

Figure 1
Figure 1
Inactivation of PTEN leads to intestinal polyposis. (a) Illustration of crypt and villus regions of intestines in which intestinal stem cells (ISCs), proliferating progenitor cells and differentiated cells are located in spatially defined compartments. (b–e) Histology slides showing Cre expression and targeting efficiency in crypt cells, including ISC (red arrow in b represents Musashi+ cells) using the compound genetic mouse model Mx1-Cre+;Ptenfl/fl;Z/EG. Green staining is present where Cre activity has deleted the PTEN gene and activated GFP in the reporter. The number of days after pIpC induction is shown in parentheses. (f) PCR confirmation of successful targeting of the PTEN gene. Lane 1, homozygote with both Pten alleles flanked by LoxP sites; Lane 2, wild-type (Wt) line; Lane 3, heterozygote; Lane 4, efficient deletion of exon5 (ex5) in the Pten locus. (g) Photograph of multiple intestinal polyps formed in the PTEN mutant animals. (h) Stained histology slide of a polyp from a Pten-deficient mouse one month after pIpC injection. (i–k) Comparison of the proliferation zones, as measured by 3-h BrdU-pulse labeling, in the intestines of control and Pten-deficient mice. k shows the boxed region in j at higher magnification. (l) Comparison of the proliferation index of control and Pten-deficient mice. Error bars represent s.d.
Figure 2
Figure 2
PTEN expression in the intestine and the impact of PTEN inactivation on the activity of the PI3K-Akt pathway and on the expression of cell cycle regulators. (a–c) Dual immunofluorescence using a pan-PTEN antibody to detect both p-PTEN and non-p-PTEN and an antibody to BrdU to detect pulse-labeled cells. PTEN protein is detected in portions of the transit amplification compartment that are not actively cycling (b). PTEN is also highly expressed in the ISC position (c). The left and right boxes in a are shown at higher magnification in b and c, respectively. (d) Protein blot and RT-PCR analysis of PTEN-deficient intestine. Top and bottom panels (protein blots) demonstrate increased levels of p-Akt and p-GSK3β (top) and cyclinD1 (bottom). An RT-PCR assay also showed increased levels of Myc and cyclinD1 (center panel). (e) Microarray assay analysis showing changes in cell cycle-related genes in the PTEN-deficient mouse. Heat map represents signal of an individual sample relative to the average of all five samples. Asterisk indicates genes identified with the BioCarta term ‘cell cycle: G1/S checkpoint’.
Figure 3
Figure 3
PTEN-deficient intestinal stem cells were found at the initiation of crypt budding and fission. (a) Association of Musashi1 (red), with BrdU (BrdU-LTR; green) cells in control mice. (b) In control mice, ISCs, identified as Musashi1+ (green) are in most cases Ki67 and therefore slow cycling. (c,d) The percentage of double-positive (Musashi1+ Ki67+) cells was higher in PTEN-deficient intestine. (e) Microdissected crypt showing crypt fission in the PTEN-deficient intestine. (f,g) M+ISC/p cells are detected in the apex of bifurcated fission crypts. Boxed area in f is shown at higher magnification in g. (h) A schematic showing the relationship between M+ISC/p cells (red) and crypt fission. (i) Microdissected crypt showing crypt budding in the PTEN-deficient intestine. (j,k) M+ISC/p cells found at the initiation point of crypt budding or de novo crypt formation. White arrows indicate clusters of M+ISC/p cells detected in a region undergoing invagination (j) and budding (k). The boxed area in j shows a newly formed crypt (shown at higher magnification in k). (l) Graph showing increased percentage of crypt fission and budding in the PTEN mutants. (m,n) Increase in M+ISC/p cells in the polyp region (M) and duplicate M+ISC/p cells in the newly formed crypt (n). The majority of M+ISC/p cells in the polyp region are Ki67 (n). Boxed area in m is shown at higher magnification in n. (o) Model of involvement of M+ISC/p cells (red) in de novo crypt formation in the PTEN-deficient polyp region.
Figure 4
Figure 4
PI3K-Akt pathway and its downstream targets operate in ISCs when PTEN is inactivated. (a–d) Expression of Musashi1, components of the PTEN-Akt pathway and nuclear cyclinD1 in ISCs. Musashi1 colocalizes with 14-3-3ζ (a) and p-PTEN (b). PTEN-Akt signaling in ISCs is associated with nuclear p27kip1 or nuclear plus cytoplasmic p27kip1 (c) and nuclear cyclinD1 (d). (e–j) The number of p-Akt+ (e–g) and p-GSK3β-Ser9+ (h–j) cells is higher in the polyp regions of the PTEN-deficient mice (f,g,i–j) than in intestine from control mice (e,h). Red arrows indicate strongly positive cells. f,g and i–j are adjacent sections from the same polyp. Control sections show that cells at the ISC position are strongly positive for p-Akt (e) and p-GSK3β-Ser9 (h). Boxed areas in f and i are shown at higher magnification in g and j, respectively. (k–m) Top-Gal detects cells with β-catenin transcriptional activity, found mainly in cells at the stem and Paneth cell positions in control mice but in multiple places in PTEN-deficient mice (Supplementary Fig. 4). (n–p) The number of cells with a high level of nuclear cyclinD1 was higher in the polyp region of PTEN-deficient mice (o–p) than in the control (n). Boxed area in o is shown at higher magnification in p. (q–s) The number of cells with nuclear p27kip1 (red arrows) was higher in the polyp region of PTEN mutants (r,s) than in control intestine (q). Boxed area in r is shown at higher magnification in s. (t) Protein blot comparison of the amount and phosphorylation state of p27kip1 in control intestines and PTEN-deficient polyps. (u) Illustration of the PTEN-Akt signaling pathway that assists Wnt in controlling β-catenin activity. (v) Illustration of the PTEN-Akt signaling pathway that controls cell cycle entry and progression.
Figure 5
Figure 5
Identification of the Akt phosphorylation site at the C terminus of β-catenin. (a) Scansite 2.0 output identifying Ser552 as a putative Akt phosphorylation site (basophilic serine-threonine kinase site) at the C terminus of β-catenin. The site is located in the 10th of the 12 armadillo (Arm) repeats and has high accessibility. (b) Mass spectrometry analysis identified a phosphorylated peptide generated by incubation of β-catenin protein with activated Akt. A high-intensity peak corresponding to loss of 98 Da (–98) is indicative of phosphorylation. Additional peaks correspond to the b- and y-ions expected for the peptide shown in c. (c) Amino acid sequence of the β-catenin peptide identified as containing an Akt phosphorylation site, showing the masses of the expected b- and y-ions. The asterisk marks the phosphorylated Ser552. (d) Confirmation that anti-p-β-cat-Ser552, recognizes the active form of β-catenin. Immunoprecipitation (IP) was performed using anti-p-β-cat-Ser552 or IgG as a control and subsequently blotted using an antibody to N-terminally nonphosphorylated β-catenin (NT-nP) from purified crypts. Image at right shows purified crypts used for the IP assay. (e) Protein blot determination of the specificity of anti-p-β-cat-Ser552 using nonphosphorylated (nP) and phosphorylated (p) peptide block.
Figure 6
Figure 6
Akt activity coincides with nuclear p-β-cat-Ser552 and β-catenin–dependent transcriptional activity in ISCs. (a) Protein blot analyses comparing the protein levels of nuclear β-catenin in crypt nuclear extract in control and PTEN-deficient intestines. A phosphorylated peptide (p-Pep) blocker was able to specifically inhibit binding of β-catenin by anti-p-β-cat-Ser552. (b,c) Cells at the stem cell position have nuclear p-β-cat-Ser552 (b). Signal detected by anti-p-β-cat-Ser552 can be blocked by a phosphorylated peptide blocker (c). (d–g) Distribution pattern of β-catenin in crypts as detected by an antibody to the N-terminally nonphosphorylated form (NT-nP) (d,f) and anti-p-β-cat-Ser552 (e,g). Red arrows indicate ISC position (d,e) and dividing ISCs (f,g). MC: mesenchymal cell. (h–k) Active Akt and nuclear p-β-cat-Ser552 correlated with Top-Gal activity in some crypt cells, including ISCs. Control: Mx1-Cre+:Ptenfl/+. ‘PTEN mut’: Mx1-Cre+: Ptenfl/fl. (l,m) Illustration of the regulation of nuclear β-catenin by Wnt and Akt pathways, suggesting a relationship between phosphorylation and nuclear activity of β-catenin. Nuclear-localized forms of β-catenin are identified by nonphosphorylation at the N terminus, by C-terminal phosphorylation at Ser552, or both.
Figure 7
Figure 7
Cells with nuclear p-β-cat-Ser552 initiate crypt fission and budding. (a–c) In PTEN-deficient polyps, a cluster of cells with nuclear p-β-cat-Ser552 was found at the apex of the ridge of dividing crypts in crypt fission (a,b) and at the point of initiation of a budding crypt (c). (d,e) Serial view of a dividing crypt (fission) (d) and a budding crypt (e) in the PTEN mutants, detected using a confocal Z-stack in which cells with nuclear p-β-cat-Ser552 were found at the point of initiation of fission or budding. Cryptdin was used to detect Paneth cells (see Supplementary Videos 1 and 2).

References

    1. Reya T, Morrison SJ, Clarke MF, Weissman IL. Stem cells, cancer, and cancer stem cells. Nature. 2001;414:105–111. - PubMed
    1. Lapidot T, et al. A cell initiating human acute myeloid leukaemia after transplantation into SCID mice. Nature. 1994;367:645–648. - PubMed
    1. Al-Hajj M, Wicha MS, Benito-Hernandez A, Morrison SJ, Clarke MF. Prospective identification of tumorigenic breast cancer cells. Proc. Natl. Acad. Sci. USA. 2003;100:3983–3988. - PMC - PubMed
    1. Singh SK, et al. Identification of human brain tumour initiating cells. Nature. 2004;432:396–401. - PubMed
    1. Potten CS, Owen G, Booth D. Intestinal stem cells protect their genome by selective segregation of template DNA strands. J. Cell Sci. 2002;115:2381–2388. - PubMed

Publication types

Associated data