. 2007 Jan 19;3(1):e14.
doi: 10.1371/journal.pgen.0030014.

Reductive genome evolution from the mother of Rickettsia

Affiliations

Reductive genome evolution from the mother of Rickettsia

Guillaume Blanc et al. PLoS Genet. .

Abstract

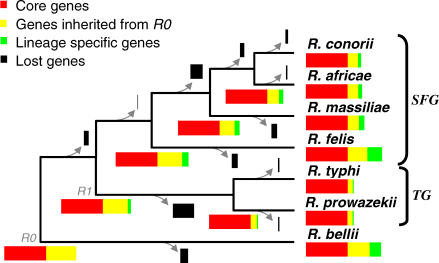
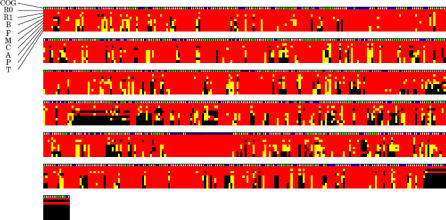
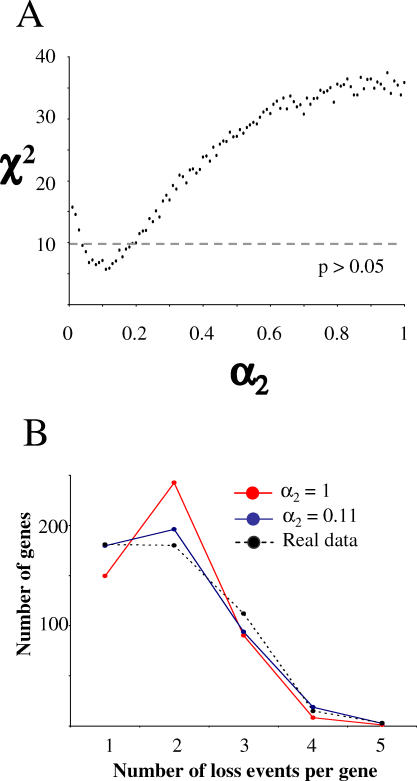
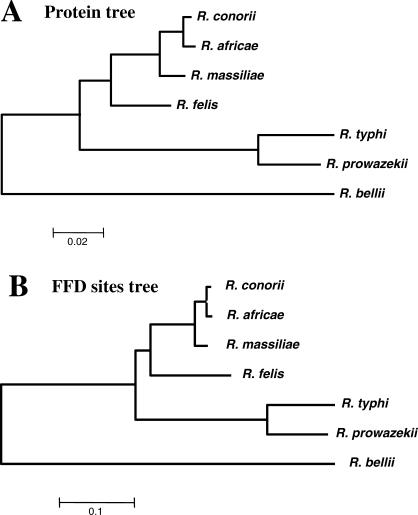
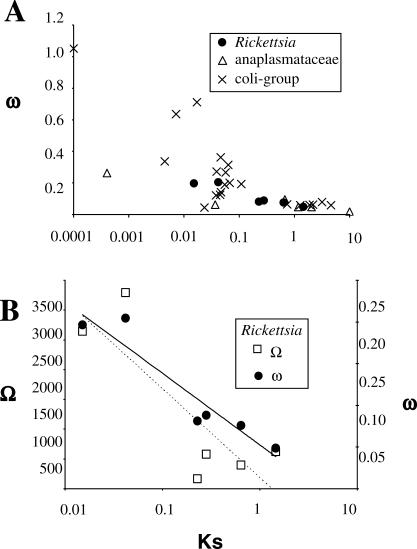
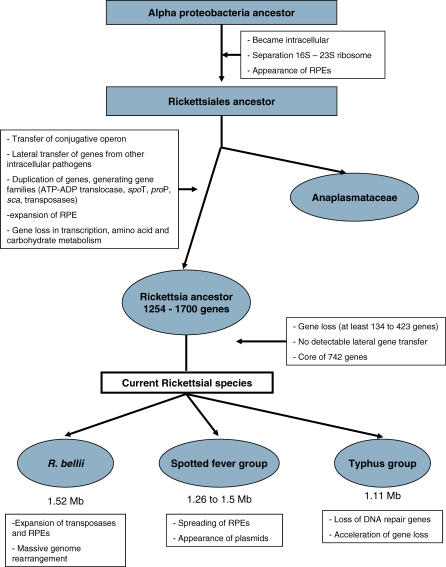
The Rickettsia genus is a group of obligate intracellular alpha-proteobacteria representing a paradigm of reductive evolution. Here, we investigate the evolutionary processes that shaped the genomes of the genus. The reconstruction of ancestral genomes indicates that their last common ancestor contained more genes, but already possessed most traits associated with cellular parasitism. The differences in gene repertoires across modern Rickettsia are mainly the result of differential gene losses from the ancestor. We demonstrate using computer simulation that the propensity of loss was variable across genes during this process. We also analyzed the ratio of nonsynonymous to synonymous changes (Ka/Ks) calculated as an average over large sets of genes to assay the strength of selection acting on the genomes of Rickettsia, Anaplasmataceae, and free-living gamma-proteobacteria. As a general trend, Ka/Ks were found to decrease with increasing divergence between genomes. The high Ka/Ks for closely related genomes are probably due to a lag in the removal of slightly deleterious nonsynonymous mutations by natural selection. Interestingly, we also observed a decrease of the rate of gene loss with increasing divergence, suggesting a similar lag in the removal of slightly deleterious pseudogene alleles. For larger divergence (Ks > 0.2), Ka/Ks converge toward similar values indicating that the levels of selection are roughly equivalent between intracellular alpha-proteobacteria and their free-living relatives. This contrasts with the view that obligate endocellular microorganisms tend to evolve faster as a consequence of reduced effectiveness of selection, and suggests a major role of enhanced background mutation rates on the fast protein divergence in the obligate intracellular alpha-proteobacteria.


Conflict of interest statement

Competing interests. The authors have declared that no competing interests exist.

Figures

Figure 1
Figure 1. Rickettsia Phylogeny and Gene Contents
The concatenated multiple alignment of the 704 core proteins was analyzed using neighbor joining, maximum parsimony, and maximum likelihood phylogenetic tree reconstruction methods. All methods produced the same tree topology with maximal bootstrap scores. The earliest diverging species, R. bellii, was chosen to root the tree [65,66]. The R0 and R1 ancestor are indicated as well as SFG and TG. The branch lengths are not to scale. Colored rectangles represent the gene repertoires of ancestral and modern Rickettsia. Rectangle widths are proportional to the number of genes.
Figure 2
Figure 2. Schematic Representation of Modern and Ancestral (R0 and R1) Rickettsia Genomes
The state of a RIG for each species or node is represented by a small box colored in red (full-length), yellow (pseudogene), or black (absent). COG classifications of the RIGs are given in the first line of the alignment: information storage and processing (blue), cellular processes (green), metabolism (pink), and poorly characterized (gray). The COG classification was assigned based on the RPSBLAST E-value of 10−5. The RIGs are ordered according to the inferred genome arrangement in the R1 node, except for R. bellii-specific RIGs that are displayed at the end of the alignment. Species name abbreviations are as follows: B (R. bellii), F (R. felis), M (R. massiliae), C (R. conorii), A (R. africae), P (R. prowazekii), and T (R. typhi). Each row of alignment corresponds to 200 RIGs.
Figure 3
Figure 3. The Simulation of Gene Losses Using the Model M2
(A) Goodness of fit of the model M2 to the real data (χ2) in function of the ratio of propensity of loss α2. For each value of α2, the χ2 statistics were calculated between the distribution of the number of loss events per gene among the 491 dispensable Rickettsia genes and the average distribution obtained from 100 simulations with the model M2. (B) Distributions of number of loss events per gene obtained with the model M2 (averaged from 100 simulations) for selected values of α2.
Figure 4
Figure 4. Estimation of the Branch Lengths in the Rickettsia Tree Using the Maximum Likelihood Method
(A) Branch lengths estimated from the concatenated core protein alignment (218,887 amino acid sites) using the JTT + Γ substitution model. (B) Branch lengths were estimated from the 55,542 FFD positions of the core genes using the HKY + N2 substitution model [62].
Figure 5
Figure 5. Associations between ω or Ω and Ks
(A) The ratio ω = Ks/Ka and Ks were estimated between all possible pairs of genomes within a bacterial group using the concatenated alignment of 198 conserved orthologous genes. Values estimated from phylogenetically redundant pairs (e.g., R. felis and R. conorii; R. felis and R. africae) were averaged. (B) The Ω ratios (number of gene loss to Ks) were calculated between all possible pairs of Rickettsia genomes and close values were averaged. The number of gene loss between any two genomes was taken as the sum of the loss events inferred along the branches separating the two species (Figure 1). A logarithmic regression of Ω is represented by a dashed line. The corresponding ω ratios (same as Figure 5A) and the associated logarithmic regression (black line) are given for comparison.
Figure 6
Figure 6. Linear Representation of Rickettsia Genomes
The size of horizontal bars corresponds to genome size. Orthologous relationships of the genes for two adjacently aligned genomes are indicated by green (if orthologs are encoded in the same direction) or red lines (if orthologs are encoded in different directions).
Figure 7
Figure 7. Tentative Scenario Retracing the Evolution of Rickettsia

References

    1. Wernegreen JJ. For better or worse: Genomic consequences of intracellular mutualism and parasitism. Curr Opin Genet Dev. 2005;15:572–583. - PubMed
    1. Raoult D, Roux V. Rickettsioses as paradigms of new or emerging infectious diseases. Clin Microbiol Rev. 1997;10:694–719. - PMC - PubMed
    1. Azad AF, Beard CB. Rickettsial pathogens and their arthropod vectors. Emerg Infect Dis. 1998;4:179–186. - PMC - PubMed
    1. Andersson SG, Zomorodipour A, Andersson JO, Sicheritz-Ponten T, Alsmark UC, et al. The genome sequence of Rickettsia prowazekii and the origin of mitochondria. Nature. 1998;396:133–140. - PubMed
    1. Ogata H, Audic S, Renesto-Audiffren P, Fournier PE, Barbe V, et al. Mechanisms of evolution in Rickettsia conorii and R. prowazekii . Science. 2001;293:2093–2098. - PubMed

Publication types

Associated data