

Interferon-beta therapy reduces CD4+ and CD8+ T-cell reactivity in multiple sclerosis
- PMID: 17239199
- PMCID: PMC2265917
- DOI: 10.1111/j.1365-2567.2006.02518.x
Interferon-beta therapy reduces CD4+ and CD8+ T-cell reactivity in multiple sclerosis
Abstract
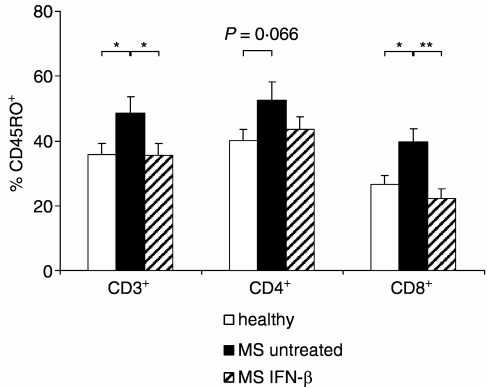
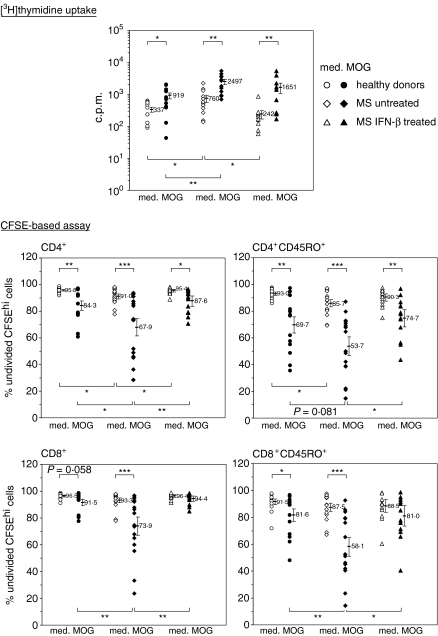
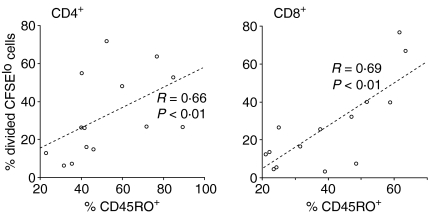
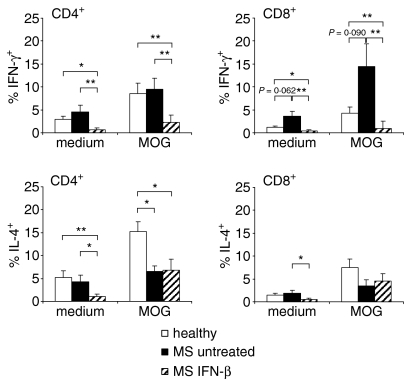
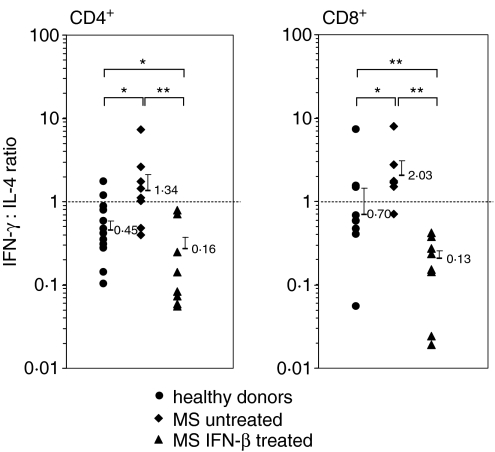
Therapy with interferon-beta (IFN-beta) has well-established clinical effects in multiple sclerosis (MS), albeit the immunomodulatory mechanisms are not fully understood. We assessed the prevalence and functional capacity of CD4+ and CD8+ T cells in healthy donors, and in untreated and IFN-beta-treated MS patients, in response to myelin oligodendrocyte glycoprotein (MOG). The proportion of CD45RO+ memory T cells was higher in MS patients than in healthy donors, but returned to normal values upon therapy with IFN-beta. While CD45RO+ CD4+ T cells from all three groups responded to MOG in vitro, untreated patients showed augmented proliferative responses compared to healthy individuals and IFN-beta treatment reduced this elevated reactivity back to the values observed in healthy donors. Similarly, the response of CD45RO+ CD8+ T cells to MOG was strongest in untreated patients and decreased to normal values upon immunotherapy. Overall, the frequency of peripheral CD45RO+ memory T cells ex vivo correlated with the strength of the cellular in vitro response to MOG in untreated patients but not in healthy donors or IFN-beta-treated patients. Compared with healthy individuals, responding CD4+ and CD8+ cells were skewed towards a type 1 cytokine phenotype in untreated patients, but towards a type 2 phenotype under IFN-beta therapy. Our data suggest that the beneficial effect of IFN-beta in MS might be the result of the suppression or depletion of autoreactive, pro-inflammatory memory T cells in the periphery. Assessment of T-cell subsets and their reactivity to MOG may represent an important diagnostic tool for monitoring successful immunotherapy in MS.
Figures
Similar articles
-
Monocyte-derived HLA-G acts as a strong inhibitor of autologous CD4 T cell activation and is upregulated by interferon-beta in vitro and in vivo: rationale for the therapy of multiple sclerosis.J Neuroimmunol. 2005 Feb;159(1-2):155-64. doi: 10.1016/j.jneuroim.2004.09.016. Epub 2004 Dec 28. J Neuroimmunol. 2005. PMID: 15652415
-
Time-dependent cytokine deviation toward the Th2 side in Japanese multiple sclerosis patients with interferon beta-1b.J Neurol Sci. 2004 Jul 15;222(1-2):65-73. doi: 10.1016/j.jns.2004.04.012. J Neurol Sci. 2004. PMID: 15240198 Clinical Trial.
-
Dynamic T-lymphocyte chemokine receptor expression induced by interferon-beta therapy in multiple sclerosis.Scand J Immunol. 2006 Aug;64(2):155-63. doi: 10.1111/j.1365-3083.2006.01788.x. Scand J Immunol. 2006. PMID: 16867161
-
IFN-β differentially regulates the function of T cell subsets in MS and EAE.Cytokine Growth Factor Rev. 2016 Aug;30:47-54. doi: 10.1016/j.cytogfr.2016.03.013. Epub 2016 Mar 22. Cytokine Growth Factor Rev. 2016. PMID: 27033173 Review.
-
Meta-Analysis of the Changes of Peripheral Blood T Cell Subsets in Patients with Brucellosis.J Immunol Res. 2018 May 17;2018:8439813. doi: 10.1155/2018/8439813. eCollection 2018. J Immunol Res. 2018. PMID: 29888294 Free PMC article. Review.
Cited by
-
Investigating the shared genetic architecture between multiple sclerosis and inflammatory bowel diseases.Nat Commun. 2021 Sep 24;12(1):5641. doi: 10.1038/s41467-021-25768-0. Nat Commun. 2021. PMID: 34561436 Free PMC article.
-
Longitudinal analysis reveals that delayed bystander CD8+ T cell activation and early immune pathology distinguish severe COVID-19 from mild disease.Immunity. 2021 Jun 8;54(6):1257-1275.e8. doi: 10.1016/j.immuni.2021.05.010. Epub 2021 May 16. Immunity. 2021. PMID: 34051148 Free PMC article.
-
Body fluid biomarkers in multiple sclerosis: how far we have come and how they could affect the clinic now and in the future.Expert Rev Clin Immunol. 2015 Jan;11(1):69-91. doi: 10.1586/1744666X.2015.991315. Epub 2014 Dec 18. Expert Rev Clin Immunol. 2015. PMID: 25523168 Free PMC article. Review.
-
Nucleotide modifications enable rational design of TLR7-selective ligands by blocking RNase cleavage.J Exp Med. 2024 Feb 5;221(2):e20230341. doi: 10.1084/jem.20230341. Epub 2023 Dec 14. J Exp Med. 2024. PMID: 38095631 Free PMC article.
-
Humoral- and T-Cell-Specific Immune Responses to SARS-CoV-2 mRNA Vaccination in Patients With MS Using Different Disease-Modifying Therapies.Neurology. 2022 Feb 1;98(5):e541-e554. doi: 10.1212/WNL.0000000000013108. Epub 2021 Nov 22. Neurology. 2022. PMID: 34810244 Free PMC article.
References
-
- Hafler DA, Slavik JM, Anderson DE, O'Connor KC, de Jager P, Baecher-Allan C. Multiple sclerosis. Immunol Rev. 2005;204:208–31. - PubMed
-
- Kieseier BC, Hemmer B, Hartung HP. Multiple sclerosis – novel insights and new therapeutic strategies. Curr Opin Neurol. 2005;18:211–20. - PubMed
-
- Sospedra M, Martin R. Immunology of multiple sclerosis. Annu Rev Immunol. 2005;23:683–747. - PubMed
-
- IFNB Multiple Sclerosis Study Group. Interferon β-1b is effective in relapsing–remitting multiple sclerosis. I. Clinical results of a multicenter, randomized, double-blind, placebo-controlled trial. Neurology. 1993;43:655–61. - PubMed
Publication types
MeSH terms
Substances
LinkOut - more resources
Full Text Sources
Other Literature Sources
Research Materials
