. 2007 Jan 19:3:6.
doi: 10.1186/1744-9081-3-6.

Successful syllable detection in aphasia despite processing impairments as revealed by event-related potentials

Affiliations

Successful syllable detection in aphasia despite processing impairments as revealed by event-related potentials

Frank Becker et al. Behav Brain Funct. .

Abstract

Background: The role of impaired sound and speech sound processing for auditory language comprehension deficits in aphasia is unclear. No electrophysiological studies of attended speech sound processing in aphasia have been performed for stimuli that are discriminable even for patients with severe auditory comprehension deficits.

Methods: Event-related brain potentials (ERPs) were used to study speech sound processing in a syllable detection task in aphasia. In an oddball paradigm, the participants had to detect the infrequent target syllable /ta:/ amongst the frequent standard syllable /ba:/. 10 subjects with moderate and 10 subjects with severe auditory comprehension impairment were compared to 11 healthy controls.

Results: N1 amplitude was reduced indicating impaired primary stimulus analysis; N1 reduction was a predictor for auditory comprehension impairment. N2 attenuation suggests reduced attended stimulus classification and discrimination. However, all aphasic patients were able to discriminate the stimuli almost without errors, and processes related to the target identification (P3) were not significantly reduced. The aphasic subjects might have discriminated the stimuli by purely auditory differences, while the ERP results reveal a reduction of language-related processing which however did not prevent performing the task. Topographic differences between aphasic subgroups and controls indicate compensatory changes in activation.

Conclusion: Stimulus processing in early time windows (N1, N2) is altered in aphasics with adverse consequences for auditory comprehension of complex language material, while allowing performance of simpler tasks (syllable detection). Compensational patterns of speech sound processing may be activated in syllable detection, but may not be functional in more complex tasks. The degree to which compensational processes can be activated probably varies depending on factors as lesion site, time after injury, and language task.


Figures
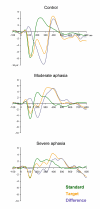
Figure 1
Figure 1
Grand average waveforms. Vertex grand average waveforms for the standard (green) and the target stimulus (orange) and the difference curve (blue grey) for the three groups respectively.
Figure 2
Figure 2
Standard syllable waveforms. Grand average waveforms elicited by the standard syllable /ba:/ for the control (green), the moderate (blue) and the severe aphasia group (red) respectively.
Figure 3
Figure 3
Individual N1 mean amplitudes. Scatter plot that shows the individual mean N1 amplitudes in μV (black dots) for each group separately, illustrating between-subject variation. Red bars indicate the respective group mean.
Figure 4
Figure 4
Topographical distribution of the N1 component. The control (left) and the moderate aphasia group (middle) show an even hemispherical distribution while the N1 of the severe aphasia group (right) is clearly lateralized to the contralesional hemisphere.
Figure 5
Figure 5
Target syllable waveforms. Grand average waveforms elicited by the target syllable /ta:/ for the control (green), the moderate (blue) and the severe aphasia group (red) respectively.
Figure 6
Figure 6
Subtraction waveforms. Grand average subtraction waveforms (target /ta:/ - standard /ba:/) for the control (green), the moderate (blue) and the severe aphasia group (red) respectively.
Figure 7
Figure 7
Subtraction wave, mean amplitudes from time windows. Mean subtraction amplitudes (target /ta:/ - standard /ba:/) at vertex illustrating the differences between the control (green), the moderate (blue) and the severe aphasia group (red) in time course and size of the N2 component. X-axis: 50 ms time-windows from 75 to 475 ms; y-axis: mean amplitudes in μV. Black bars indicate standard deviation (for graphical reasons only shown in one direction). Significant ANOVA between group effects are indicated: * p < 0.05, ** p < 0.01, *** p < 0.001.

Similar articles

Cited by

References

    1. Baker E, Blumstein SE, Goodglass H. Interaction between phonological and semantic factors in auditory comprehension. Neuropsychologia. 1981;19:1–15. doi: 10.1016/0028-3932(81)90039-7. - DOI - PubMed
    1. Basso A, Casati G, Vignolo LA. Phonemic identification defect in aphasia. Cortex. 1977;13:85–95. - PubMed
    1. Baum SR. Consonant and vowel discrimination by brain-damaged individuals: effects of phonological segmentation. J Neurolinguistics. 2002;15:447–461. doi: 10.1016/S0911-6044(00)00020-8. - DOI
    1. Blumstein SE, Baker E, Goodglass H. Phonological factors in auditory comprehension in aphasia. Neuropsychologia. 1977;15:19–30. doi: 10.1016/0028-3932(77)90111-7. - DOI - PubMed
    1. Blumstein SE, Cooper WE, Zurif EB, Caramazza A. The perception and production of Voice-Onset Time in aphasia. Neuropsychologia. 1977;15:371–372. doi: 10.1016/0028-3932(77)90089-6. - DOI - PubMed

LinkOut - more resources