. 2007;8(1):R12.
doi: 10.1186/gb-2007-8-1-r12.

Impairment of organ-specific T cell negative selection by diabetes susceptibility genes: genomic analysis by mRNA profiling

Affiliations

Impairment of organ-specific T cell negative selection by diabetes susceptibility genes: genomic analysis by mRNA profiling

Adrian Liston et al. Genome Biol. 2007.

Abstract

Background: T cells in the thymus undergo opposing positive and negative selection processes so that the only T cells entering circulation are those bearing a T cell receptor (TCR) with a low affinity for self. The mechanism differentiating negative from positive selection is poorly understood, despite the fact that inherited defects in negative selection underlie organ-specific autoimmune disease in AIRE-deficient people and the non-obese diabetic (NOD) mouse strain

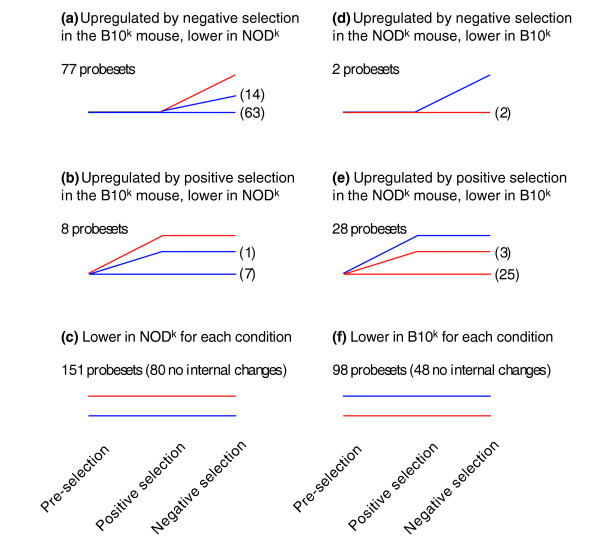
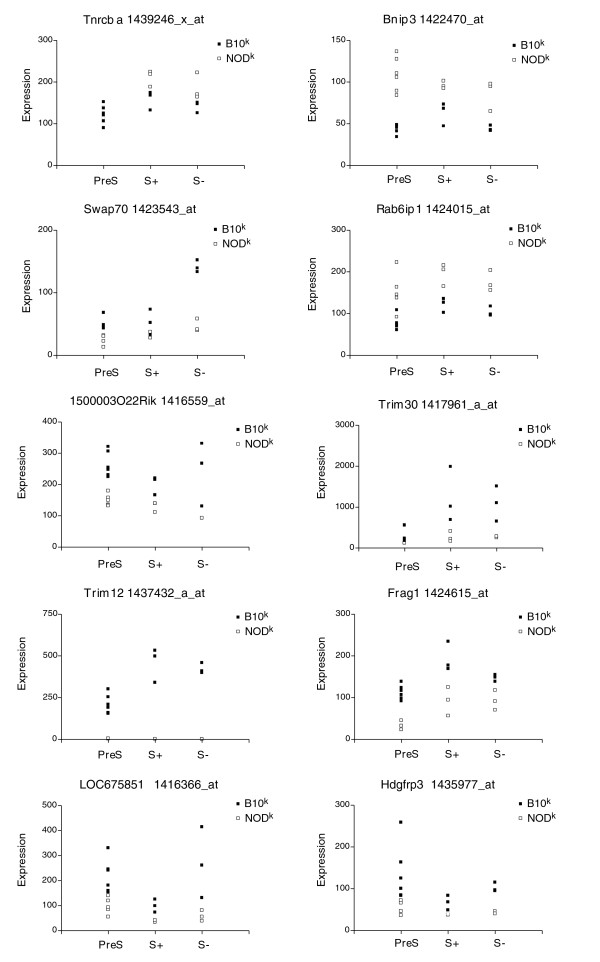
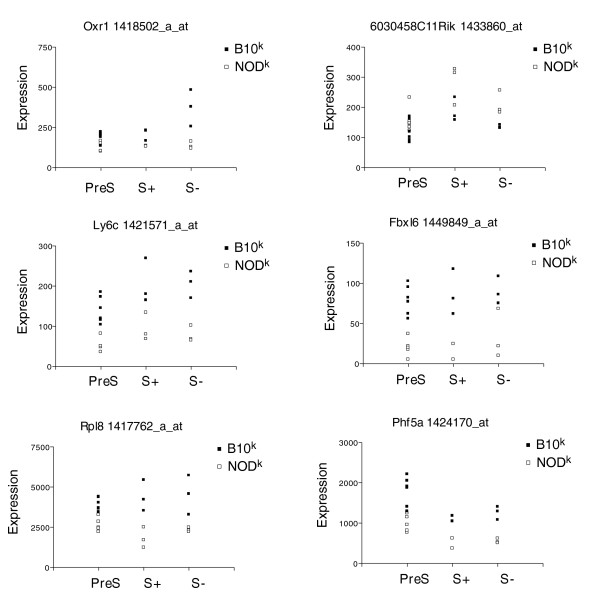
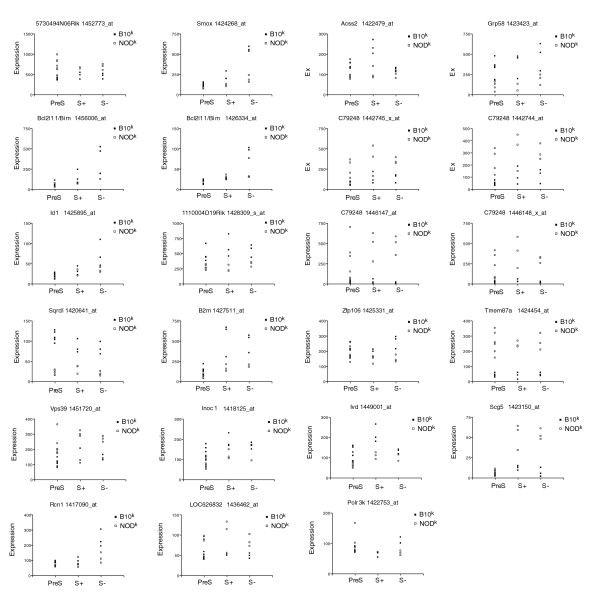
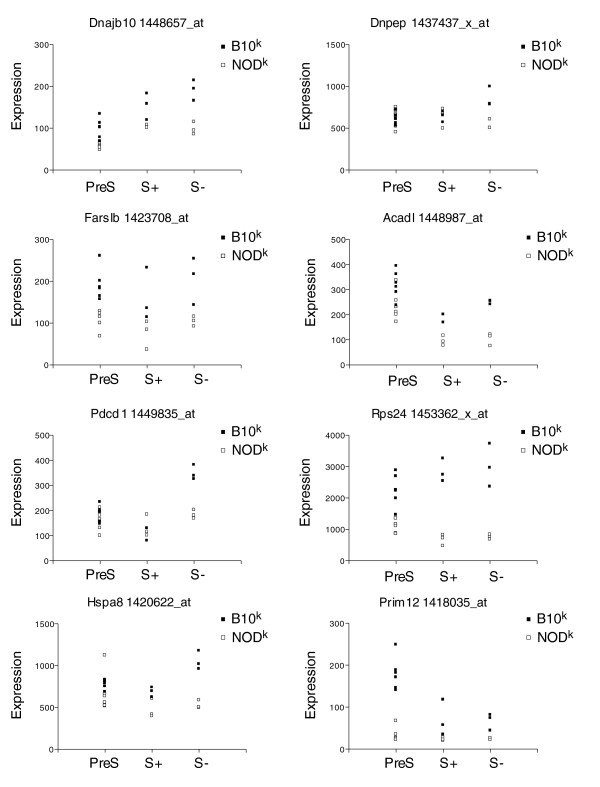
Results: Here we use homogeneous populations of T cells undergoing either positive or negative selection in vivo together with genome-wide transcription profiling on microarrays to identify the gene expression differences underlying negative selection to an Aire-dependent organ-specific antigen, including the upregulation of a genomic cluster in the cytogenetic band 2F. Analysis of defective negative selection in the autoimmune-prone NOD strain demonstrates a global impairment in the induction of the negative selection response gene set, but little difference in positive selection response genes. Combining expression differences with genetic linkage data, we identify differentially expressed candidate genes, including Bim, Bnip3, Smox, Pdrg1, Id1, Pdcd1, Ly6c, Pdia3, Trim30 and Trim12.

Conclusion: The data provide a molecular map of the negative selection response in vivo and, by analysis of deviations from this pathway in the autoimmune susceptible NOD strain, suggest that susceptibility arises from small expression differences in genes acting at multiple points in the pathway between the TCR and cell death.


Figures

Figure 1
Figure 1
Global gene expression differences induced upon positive or negative selection on the B10k and NODk genetic backgrounds. The global difference in gene expression between conditions was calculated as a Euclidean distance, taking into account the number of genes with differential expression, and the scale of differential expression, for each replicate chip. Euclidean distances are represented as the distance between conditions for both the B10k and NODk genetic backgrounds, with the average positions of groups located at the apexes of the triangles. Dotted lines correspond to the Euclidean distance between B10k and NODk genetic backgrounds, for the same population.
Figure 2
Figure 2
Patterns of gene expression changes induced by positive and negative selection in the B10k and NODk strains. Analysis of Affymetrix GeneChip data segregated those probesets that were significantly changed upon positive and/or negative selection (p < 0.005) into patterns A to F based on logical sets of significant contrasts (p < 0.05), where patterns are defined by the relative expression during pre-selection (PreS, left), positive selection (S+, middle) and negative selection (S-, right). The number of probesets falling into each pattern in B10k and NODk mice is listed on the expression pattern. Assignment of probesets to patterns was based only on direction of change, thus the graphical depictions do not represent the degree of change.
Figure 3
Figure 3
Gene expression changes localized to cytogenetic band 2F. Cytogenetic band 2F was analyzed for the relative expression values of Affymetrix annotated genes. The log2 ratio of each gene (diamonds), plotted by genomic position, is displayed for: (a) B10k PreS compared to B10k S+; (b) B10k S- compared to B10k S+; and (c) B10k S- compared to NODk S-. Comparisons of gene expression changes under these conditions were made by plotting the log2 ratios for all genes within cytogenetic band 2F against each other (diamonds) and calculating the r2 value. The distance from the origin thus reflects the degree of expression change. (d) Ratio of gene expression in B10k PreS compared to B10k S+ (y-axis) versus the ratio of expression in B10k S- compared to B10k S+ (x-axis). (e) Ratio of gene expression in B10k S- compared to NODk S- (y-axis) versus B10k S- compared to B10k S+ (x-axis). In each case the probeset measuring Bim expression is indicated with a red diamond. All probesets with a relative change greater than +1 or less than -1 are shaded grey and annotated.
Figure 4
Figure 4
Graphical representation of expression changes between the B10k and NODk strains. Probesets falling in specific B10k clusters were assessed for the ratio of expression during negative selection in NODk:B10k mice. A value of 1 represents equal expression during negative selection, <1 represents lower expression in NODk thymocytes than B10k thymocytes during negative selection, and >1 represents higher expression in NODk thymocytes than B10k thymocytes during negative selection. (a) Probeset patterns from the B10k analysis increased (D, E, L) or decreased (J, K, F) specifically during negative selection trended towards showing that the same probeset in NODk thymocytes had a lower/higher expression, respectively. (b) The probeset pattern from the B10k analysis increased during maturation (A) showed roughly the same level of expression during negative selection in NODk thymocytes (divided into random groups for clarity).
Figure 5
Figure 5
Regulation of surface CD3 levels on 3A9 TCR transgenic thymocytes on the B10k and NODk genetic backgrounds. 3A9 TCR transgenic mice on the B10k and NODk backgrounds were assessed for CD3 surface levels by flow cytometry, at both the DP and SP 1G12+ developmental stages. (a) Representative histograms for CD3 expression on DP cells and SP 1G12+ cells. B10k mice are shown in grey, NODk mice in white. (b) The mean fluorescence intensity (normalized to B10k SP 1G12+ thymocytes) and standard error is shown with B10k in black and NODk in white (n = 7 for B10 values, 17 for NOD values). Significance of differences between B10k and NODk groups of the same genotype are indicated by t-test p values about the group. t-tests comparing SP 1G12+ thymocyte expression were tested using a two sided t-test of the hypothesis that NODk expression levels are different to '100'.
Figure 6
Figure 6
Grouping of key gene changes between NODk and B10k thymocytes. Analysis of Affymetrix GeneChip data segregated those probesets that were significantly modified in a 2 × 2 × 2 F-test (p < 0.005) into groups 1 to 6 based on logical sets of significant contrasts (p < 0.05). The diagrams show relative changes for the mean gene expression in the pre-selection (PreS), positive selection (S+) and negative selection (S-) conditions. The number of probesets falling into each group is listed on the group pattern. B10k expression changes are shown in red, NODk expression changes are shown in blue.
Figure 7
Figure 7
Expression of candidate genes for the D7mit101-linked defective thymic deletion allele. Individual values of biological replicates from the Affymetrix 430A microarray chips are indicated in the biological groups of 'pre-selection' (PreS), 'positive selection' (S+) and 'negative selection' (S-). Values are represented in black (B10k) and white (NODk) boxes.
Figure 8
Figure 8
Expression of candidate genes for D15mit229-linked defective thymic deletion. Individual values of biological replicates from the Affymetrix 430A microarray chips are indicated in the biological groups of 'pre-selection' (PreS), 'positive selection' (S+) and 'negative selection' (S-). Values are represented in black (B10k) and white (NODk) boxes.
Figure 9
Figure 9
Expression of candidate genes for D2mit490-linked defective thymic deletion. Individual values of biological replicates from the Affymetrix 430A microarray chips are indicated in the biological groups of 'pre-selection' (PreS), 'positive selection' (S+) and 'negative selection' (S-). Values are represented in black (B10k) and white (NODk) boxes.
Figure 10
Figure 10
Expression of candidates for the defective thymic deletion allele linked to D1mit181. Individual values of biological replicates from the Affymetrix 430A microarray chips are indicated in the biological groups of 'pre-selection' (PreS), 'positive selection' (S+) and 'negative selection' (S-). Values are represented in black (B10k) and white (NODk) boxes.

Similar articles

Cited by

  • The transcriptional landscape of αβ T cell differentiation.
    Mingueneau M, Kreslavsky T, Gray D, Heng T, Cruse R, Ericson J, Bendall S, Spitzer MH, Nolan GP, Kobayashi K, von Boehmer H, Mathis D, Benoist C; Immunological Genome Consortium; Best AJ, Knell J, Goldrath A, Joic V, Koller D, Shay T, Regev A, Cohen N, Brennan P, Brenner M, Kim F, Nageswara Rao T, Wagers A, Heng T, Ericson J, Rothamel K, Ortiz-Lopez A, Mathis D, Benoist C, Bezman NA, Sun JC, Min-Oo G, Kim CC, Lanier LL, Miller J, Brown B, Merad M, Gautier EL, Jakubzick C, Randolph GJ, Monach P, Blair DA, Dustin ML, Shinton SA, Hardy RR, Laidlaw D, Collins J, Gazit R, Rossi DJ, Malhotra N, Sylvia K, Kang J, Kreslavsky T, Fletcher A, Elpek K, Bellemare-Pelletier A, Malhotra D, Turley S. Mingueneau M, et al. Nat Immunol. 2013 Jun;14(6):619-32. doi: 10.1038/ni.2590. Epub 2013 May 5. Nat Immunol. 2013. PMID: 23644507 Free PMC article.
  • Selective ablation of thymic and peripheral Foxp3+ regulatory T cell development.
    Yilmazer A, Zevla DM, Malmkvist R, Rodríguez CAB, Undurraga P, Kirgin E, Boernert M, Voehringer D, Kershaw O, Schlenner S, Kretschmer K. Yilmazer A, et al. Front Immunol. 2023 Dec 18;14:1298938. doi: 10.3389/fimmu.2023.1298938. eCollection 2023. Front Immunol. 2023. PMID: 38164128 Free PMC article.
  • Evasion of affinity-based selection in germinal centers by Epstein-Barr virus LMP2A.
    Minamitani T, Yasui T, Ma Y, Zhou H, Okuzaki D, Tsai CY, Sakakibara S, Gewurz BE, Kieff E, Kikutani H. Minamitani T, et al. Proc Natl Acad Sci U S A. 2015 Sep 15;112(37):11612-7. doi: 10.1073/pnas.1514484112. Epub 2015 Aug 24. Proc Natl Acad Sci U S A. 2015. PMID: 26305967 Free PMC article.
  • Thymic negative selection is functional in NOD mice.
    Mingueneau M, Jiang W, Feuerer M, Mathis D, Benoist C. Mingueneau M, et al. J Exp Med. 2012 Mar 12;209(3):623-37. doi: 10.1084/jem.20112593. Epub 2012 Feb 13. J Exp Med. 2012. PMID: 22329992 Free PMC article.
  • Zeb1 represses TCR signaling, promotes the proliferation of T cell progenitors and is essential for NK1.1+ T cell development.
    Zhang J, Wencker M, Marliac Q, Berton A, Hasan U, Schneider R, Laubreton D, Cherrier DE, Mathieu AL, Rey A, Jiang W, Caramel J, Genestier L, Marçais A, Marvel J, Ghavi-Helm Y, Walzer T. Zhang J, et al. Cell Mol Immunol. 2021 Sep;18(9):2140-2152. doi: 10.1038/s41423-020-0459-y. Epub 2020 May 12. Cell Mol Immunol. 2021. PMID: 32398809 Free PMC article.

References

    1. Kappler JW, Roehm N, Marrack P. T cell tolerance by clonal elimination in the thymus. Cell. 1987;49:273–280. doi: 10.1016/0092-8674(87)90568-X. - DOI - PubMed
    1. Starr TK, Jameson SC, Hogquist KA. Positive and negative selection of T cells. Annu Rev Immunol. 2003;21:139–176. doi: 10.1146/annurev.immunol.21.120601.141107. - DOI - PubMed
    1. Anderson MS, Venanzi ES, Klein L, Chen Z, Berzins S, Turley SJ, Von Boehmer H, Bronson R, Dierich A, Benoist C, Mathis D. Projection of an immunological self shadow within the thymus by the aire protein. Science. 2002;298:1395–1401. doi: 10.1126/science.1075958. - DOI - PubMed
    1. Liston A, Gray DH, Lesage S, Fletcher AL, Wilson J, Webster KE, Scott HS, Boyd RL, Peltonen L, Goodnow CC. Gene dosage-limiting role of Aire in thymic expression, clonal deletion and organ-specific autoimmunity. J Exp Med. 2004;200:1015–1026. doi: 10.1084/jem.20040581. - DOI - PMC - PubMed
    1. Liston A, Lesage S, Wilson J, Peltonen L, Goodnow CC. Aire regulates negative selection of organ-specific T cells. Nat Immunol. 2003;4:350–354. doi: 10.1038/ni906. - DOI - PubMed

Publication types

MeSH terms