. 2007 Jan;1769(1):29-40.
doi: 10.1016/j.bbaexp.2006.11.006. Epub 2006 Nov 22.

RNAPol-ChIP analysis of transcription from FSHD-linked tandem repeats and satellite DNA

Affiliations

RNAPol-ChIP analysis of transcription from FSHD-linked tandem repeats and satellite DNA

Vassilios Alexiadis et al. Biochim Biophys Acta. 2007 Jan.

Abstract

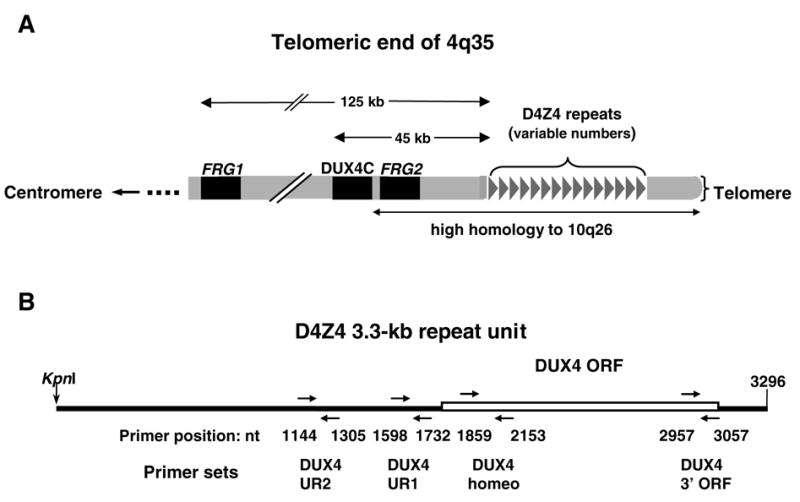
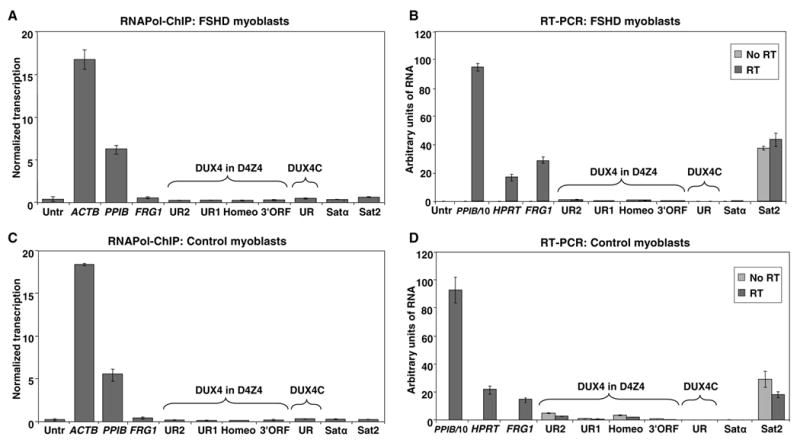
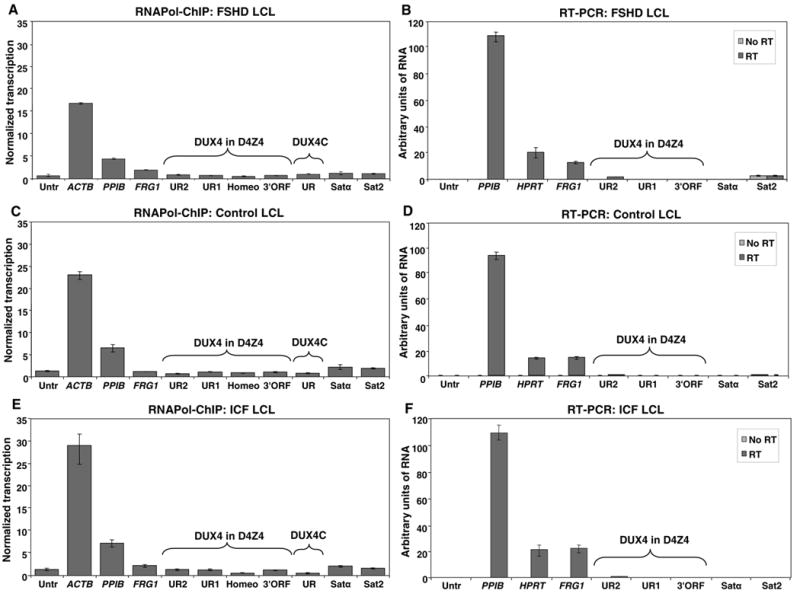
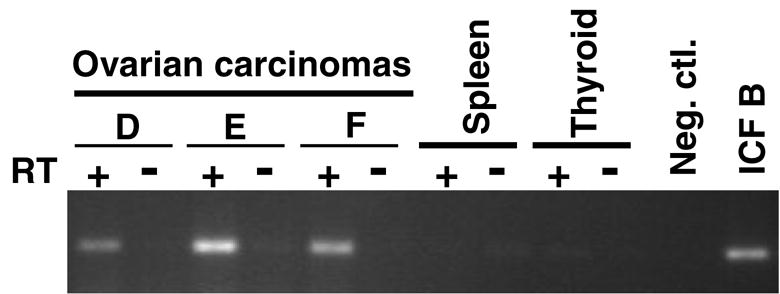
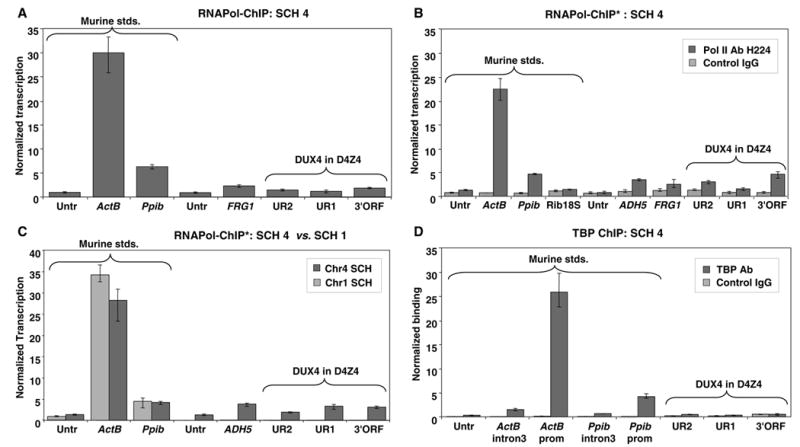
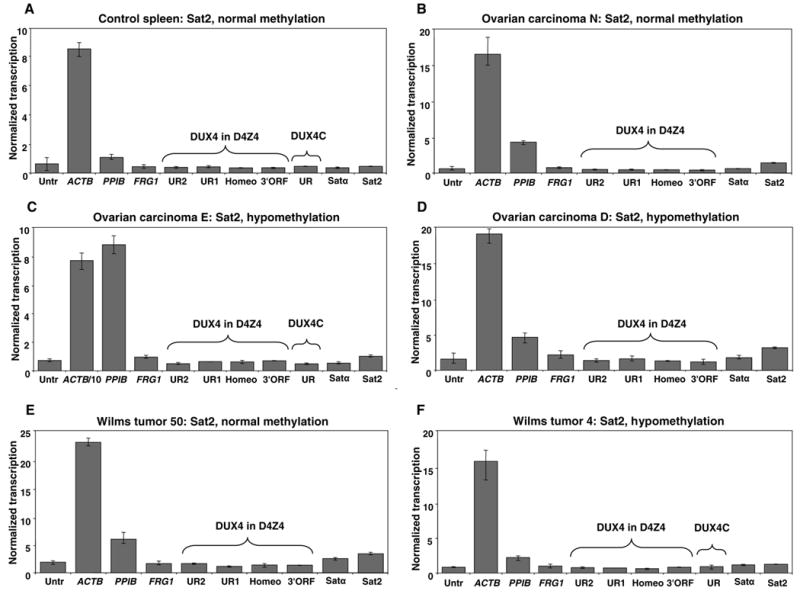
RNA interference (RNAi) is implicated in maintaining tandem DNA arrays as constitutive heterochromatin. We used chromatin immunoprecipitation with antibodies to RNA polymerase II (RNAPol-ChIP) to test for transcription of the following repeat arrays in human cells: subtelomeric D4Z4, pericentromeric satellite 2, and centromeric satellite alpha. D4Z4 has a promoter-like sequence upstream of an ORF in its 3.3-kb repeat unit. A short D4Z4 array at 4q35 is linked to facioscapulohumeral muscular dystrophy (FSHD). By RNAPol-ChIP and RT-PCR, little or no transcription of D4Z4 was detected in FSHD and normal myoblasts; lymphoblasts from an FSHD patient, a control, and a patient with D4Z4 hypomethylation due to mutation of DNMT3B (ICF syndrome); and normal or cancer tissues. However, RNAPol-ChIP assays indicated transcription of D4Z4 in a chromosome 4-containing human-mouse somatic cell hybrid. ChIP and RT-PCR showed satellite DNA transcription in some cancers and lymphoblastoid cell lines, although only at a low level. Given the evidence for the involvement of RNAi in satellite DNA heterochromatinization, it is surprising that, at most, a very small fraction of satellite DNA was associated with RNA Pol II. In addition, our results do not support the previously hypothesized disease-linked differential transcription of D4Z4 sequences in short, FSHD-linked arrays.


Figures

Fig. 1
Fig. 1
Schematic illustration of the distal region of 4q35 and the repeat unit of D4Z4. (A), positions of the size-polymorphic D4Z4 array; FRG1 and FRG2, the only known genes in the distal portion of 4q35; and DUX4C, a putative gene, are illustrated (not to scale). From one to about 100 repeat units can be present in the D4Z4 array. Small numbers of repeat units at 4q35 are linked to FSHD. The region of 4q35 that is highly homologous to the subtelomeric region of 10q, including the D4Z4 array, is indicated. DUX4C is highly homologous to, but in the opposite orientation from, DUX4 in the D4Z4 array; FRG2 is in the same direction as DUX4C. (B), The DUX4 ORF within the 3.3-kb D4Z4 repeat unit and the primers used to test for transcription from D4Z4 are shown with positions given relative to the first base of the KpnI site in the 3.3-kb D4Z4 repeat unit (from GenBank AF11753). The DUX4 UR1 primers are partially homologous to a subrepeat called hhspm3 (GenBank X06587).
Fig. 2
Fig. 2
Transcriptional analysis of D4Z4 and satellite DNA sequences in FSHD and control myoblasts. (A) and (C), in FSHD myoblasts (FM1010) and control myoblasts (GM17901), ChIP was done with an antibody specific for the largest subunit of RNA Pol II (ab5095), and the immunoprecipitated DNA was analyzed by qPCR using the indicated primers (Table 1). Levels of transcription were determined as described in Materials and methods and normalized to 25 ng of chromatin per immunoprecipitation. Error bars indicate maximal and minimal values from triplicate amplifications. An untranscribed region on Chr5 was the negative control (Untr); ACTB and PPIB are the positive controls. Tested subregions of the putative DUX4 gene in D4Z4 are indicated by a bracket, as is DUX4C, the putative DUX4-related gene 42 kb proximal to the D4Z4 array (Fig. 1A). FRG1, like DUX4 and DUX4C, is located on 4q35 (Fig. 1A). The tested satellite DNA repeats were Satα and Sat2. (B) and (D), total RNA from control or FSHD myoblasts was reverse transcribed with random priming and analyzed by qPCR using the indicated primers (Table 1). Samples amplified without reverse transcription (no RT) served as controls. The qPCR values obtained for PPIB were divided by 10 to bring them into the range of the other tested genomic regions before plotting. The normalized transcription levels for Panel A for Untr, FRG1, UR1, UR2, Homeo, 3′ORF, UR, Satα, and Sat2 were as follows: 0.32, 0.44, 0.22, 0.20, 0.20, 0.26, 0.40, 0.30, and 0.52, respectively. The respective values for Panel C were 0.26, 0.46, 0.16, 0.22, 0.16, 0.20, 0.34, 0.28 and 0.28. VASSILI, IN PANEL C, THE BAR FOR UR1 IS LOWER THAN THAT FOR UR2 BUT THE NUMERICAL VALUE ABOVE FOR UR1 IS HIGHER THAN FOR UR2. PLEASE CHECK THIS AND THE HOMEO, 3′ORF, AND SAT2 NUMBERS AND BARS, PLEASE.
Fig. 3
Fig. 3
Transcriptional analysis of D4Z4 and satellite DNA sequences in FSHD, ICF, and control lymphoblastoid cell lines. (A), (C), and (E), an FSHD LCL (GM17939), a control LCL (AG14836), and an ICF LCL (GM08714), respectively, were used for ChIP with an antibody specific for RNA Pol II (H-224). Immunoprecipitated DNA was analyzed by qPCR with the indicated primers, as for Fig. 2. (B), (D), and (F), RNA from the same ICF and control LCLs and a different FSHD LCL (GM17868) were analyzed by qPCR with or without reverse transcription. The normalized transcription levels for Panel A for Untr, FRG1, UR1, UR2, Homeo, 3′ORF, UR, Satα, and Sat2 were as follows: 0.7, 1.97, 0.74, 0.91, 0.62, 0.74, 1.05, 1.27, 1.13. For panel B the respective values were: 1.35, 1.19, 1.12, 0.71, 0.92, 1.03, 0.8, 2.1, 1.94. For panel C the respective values were: 1.41, 2.23, 1.27, 1.38, 0.54, 1.19, 0.48, 2.03, 1.53. VASSILI, THE BAR FOR UR2 LOOKS QUITE A BIT HIGHER THAN FOR UNTR BUT UR2’S VALUE IS ONLY ~3% HIGHER THAN UR1’S. ALSO PLEASE CHECK THE REST OF THE BARS VS. VALUES FOR HIS FIG.
Fig. 4
Fig. 4
Semi-quantitative RT-PCR analysis for Sat2 RNA transcripts. The indicated cancer samples, the LCL from ICF patient B, and normal spleen and thyroid were analyzed by RT-PCR for 28 cycles with Sat2 primers either with (+ RT) or without (- RT) reverse transcription. Priming of cDNA synthesis was done with oligo(dT).
Fig. 5
Fig. 5
Transcriptional analysis of D4Z4 in human-rodent somatic cell hybrids. ChIP analyses of a SCH with a single human chromosome (Chr4) in a murine genetic background were done using the ab5095 RNA Pol II antibody (A), the H224 RNA Pol II antibody (B and C, indicated by an asterisk), or the TBP antibody (D). ChIP analysis in (C) included testing a SCH containing human Chr1. In (B) and (D), a rabbit control IgG reaction was run in parallel. For TBP binding, the promoter regions of the murine ActB and Ppib standard genes as well as the intron 3 regions of both genes present >2 kb downstream from the transcription start sites were analyzed. As expected with this antibody, the promoter regions gave much stronger signals. Normalized transcription values are presented as described in Fig. 2. Murine standards (Murine stds.) are indicated by a bracket; all other genomic regions tested are human sequences from Chr4. In Panel A, the normalized transcription values for the twoUntr standards, FRG1, UR2, UR1 and 3′ORF were as follows: 0.93, 2.29, 1.2, 1.47, and 1.88. VASSILI, PLEASE ADD THE MURINE UNTR AND CHECK ALL BAR HEIGHTS VS. THESE NUMBERS.
Fig. 6
Fig. 6
Transcriptional analysis of D4Z4 and satellite sequences in control spleen, ovarian carcinoma, and Wilms tumor samples. ChIP analyses were performed using the ab5095 antibody for RNA Pol II. Normalized transcription is shown as described in Fig. 2. The methylation status of Sat2 DNA in the samples, which was previously determined by Southern blot analysis with a CpG methylation-sensitive restriction endonuclease (Table 2), is indicated on the top of each graph. The normalized transcription levels for Untr, Satα, and Sat2 were as follows (with the panel letter in the parenthesis): (A), 0.58, 0.34, 0.42; (B), 0.66, 0.69,1.56; (C), 0.58, 0.43,0.81; (D), 1.64,1.85, 3.3; (E), 2.07, 2.81, 3.75; (F), 0.83, 1.13,1.23.

Similar articles

Cited by

References

    1. Lu BY, Emtage PC, Duyf BJ, Hilliker AJ, Eissenberg JC. Heterochromatin protein 1 is required for the normal expression of two heterochromatin genes in Drosophila. Genetics. 2000;155:699–708. - PMC - PubMed
    1. Bernstein E, Allis CD. RNA meets chromatin. Genes Dev. 2005;19:1635–55. - PubMed
    1. Fukagawa T, Nogami M, Yoshikawa M, Ikeno M, Okazaki M, Takami Y, Nakayama T, Oshimura M. Dicer is essential for formation of the heterochromatin structure in vertebrate cells. Nat Cell Biol. 2004;6:784–791. - PubMed
    1. Rudert F, Bronner S, Garnier JM, Dolle P. Transcripts from opposite strands of gamma satellite DNA are differentially expressed during mouse development. Mamm Genome. 1995;6:76–83. - PubMed
    1. Lehnertz B, Ueda Y, Derijck AA, Braunschweig U, Perez-Burgos L, Kubicek S, Chen T, Li E, Jenuwein T, Peters AH. Suv39h-mediated histone H3 lysine 9 methylation directs DNA methylation to major satellite repeats at pericentric heterochromatin. Curr Biol. 2003;13:1192–1200. - PubMed

Publication types

LinkOut - more resources