. 2007 Mar 15;267(1-2):6-16.
doi: 10.1016/j.mce.2006.11.012. Epub 2006 Dec 16.

Regulation of carnitine palmitoyltransferase I (CPT-Ialpha) gene expression by the peroxisome proliferator activated receptor gamma coactivator (PGC-1) isoforms

Affiliations

Regulation of carnitine palmitoyltransferase I (CPT-Ialpha) gene expression by the peroxisome proliferator activated receptor gamma coactivator (PGC-1) isoforms

Prabodh Sadana et al. Mol Cell Endocrinol. .

Abstract

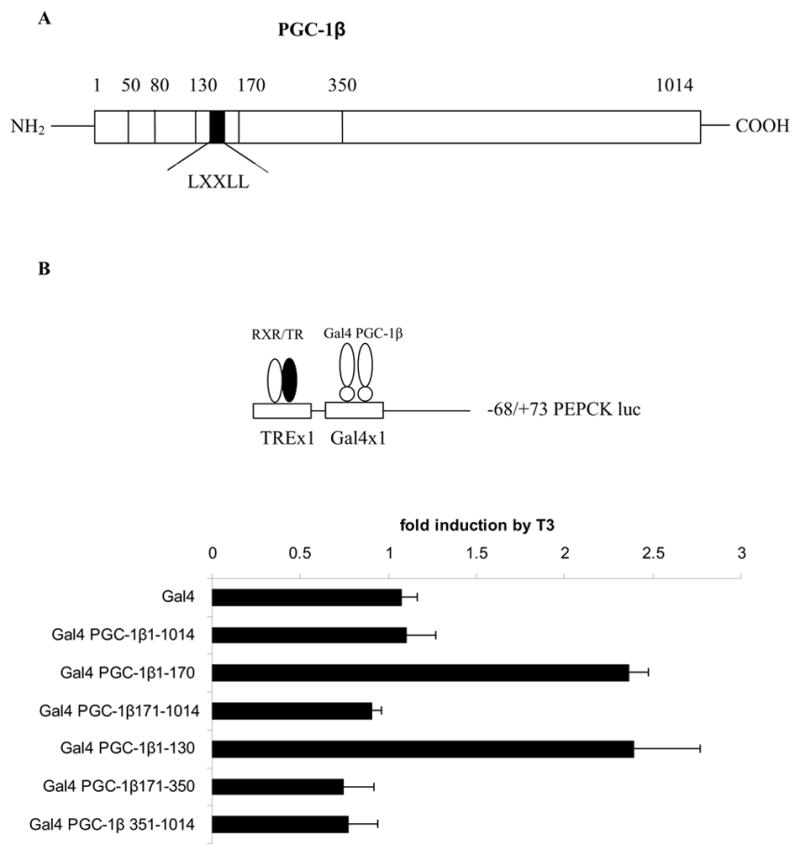
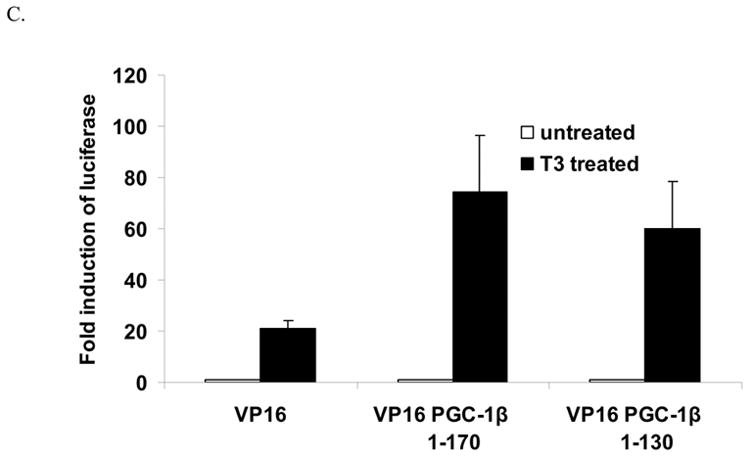
The peroxisome proliferator activated receptor gamma coactivators (PGC-1) have important roles in mitochondrial biogenesis and metabolic control in a variety of tissues. There are multiple isoforms of PGC-1 including PGC-1alpha and PGC-1beta. Both the PGC-1alpha and beta isoforms promote mitochondrial biogenesis and fatty acid oxidation, but only PGC-1alpha stimulates gluconeogenesis in the liver. Carnitine palmitoyltransferase I (CPT-I) is a key enzyme regulating mitochondrial fatty acid oxidation. In these studies, we determined that PGC-1beta stimulated expression of the "liver" isoform of CPT-I (CPT-Ialpha) but that PGC-1beta did not induce pyruvate dehydrogenase kinase 4 (PDK4) which is a regulator of pyruvate metabolism. The CPT-Ialpha gene is induced by thyroid hormone. We found that T3 increased the expression of PGC-1beta and that PGC-1beta enhanced the T3 induction of CPT-Ialpha. The thyroid hormone receptor interacts with PGC-1beta in a ligand dependent manner. Unlike PGC-1alpha, the interaction of PGC-1beta and the T3 receptor does not occur exclusively through the leucine-X-X-leucine-leucine motif in PGC-1beta. We have found that PGC-1beta is associated with the CPT-Ialpha gene in vivo. Overall, our results demonstrate that PGC-1beta is a coactivator in the T3 induction of CPT-Ialpha and that PGC-1beta has similarities and differences with the PGC-1alpha isoform.


Figures

Figure 1
Figure 1. PGC-1β and T3 stimulate CPT-1α
A, Rat primary hepatocytes were infected with adenovirus vectors expressing either PGC-1β (Ad-PGC-1β), PGC-1α (Ad-PGC-1α) or green fluorescent protein (GFP) (Ad-GFP). After 40 hours, the hepatocytes were harvested and RNA was isolated. The mRNA abundance of CPT-Iα or PDK4 was measured by real-time PCR analysis after normalization with 18S rRNA. Data are expressed as the average fold induction of CPT-Iα or PDK4 mRNA abundance in PGC-1 infected cells relative to GFP infected cells. The p< 0.01 for the PGC-1 induction is indicated by an asterisk. The infections were repeated 4 times in independent hepatocyte preparations. B, Rat primary hepatocytes were infected with Ad-GFP or Ad-PGC-1β. Mitochondria were isolated after 40 hours and the CPT-Iα enzyme activity assay was performed as described in the Experimental Procedures. Enzyme activity is expressed as nmol/min/mg protein of acyl-carnitine formed in cells infected with PGC-1β as compared to GFP. The p< 0.01 for the PGC-1β induction is indicated by the # symbol. Infections were repeated three times in duplicate in independent preparations of hepatocytes. C, HepG2 hepatoma cells were transfected with 2μg CPT-Iα luc or a TREX2 SV40 luc reporter gene containing two copies of an idealized TRE, 1μg of pSV or pSV-PGC-1β, 1μg of RSV-TRβ and 0.5μg of TK-Renilla. The following day cells were treated with 100 nM T3 for 24 hours. Cells were harvested and the luciferase activity was corrected for protein content and renilla luciferase activity. The data are expressed as fold induction of luciferase. Transfections were repeated in duplicate four times and the results shown are average ± SE. A model of CPT-Iα luc genes and TREX2 SV40 luc are shown above the figure.
Figure 2
Figure 2. Thyroid hormone increases PGC-1β mRNA in hepatocytes
Primary rat hepatocytes were treated with T3 at a concentration of 100 nM for 24 hrs. RNA was harvested and the abundance of PGC-1β mRNA was measured using real time PCR as described under “materials and methods”. The data are presented as fold induction of PGC-1β mRNA abundance by T3. The control samples were assigned a relative value of 1. The numbers represent the average ± SE from four independent hepatocyte preparations. The p< 0.01 for the T3 induction is indicated by the asterisk.
Figure 3
Figure 3. Amino terminus of PGC-1β mediates the T3 response
A, A model of the PGC-1β protein showing the relative position of the LXXLL motif is shown. B, HepG2 cells were transfected with TREX1 Gal4X1 PEPCK-luc (2 μg), CMV-TRβ (100 ng), various Gal4 PGC-1β constructs (1 μg) and TK-renilla (0.5 μg). The cells were treated with 100 nM T3 for 24 hrs. Fold induction of luciferase values by T3 was determined as described in the legend to figure 1. C, HepG2 cells were transfected with 2 μg of −4495/+1240 CPT-Iα luc, 1 μg of different Gal4 PGC-1β plasmids, 100 ng of CMV-TRβ and TK-Renilla. T3 was added at a concentration of 100 nM for 24 h. The cells were harvested and assessed for luciferase and Renilla activity. The data are expressed as induction of luciferase by T3 or PGC-1β relative to control. All transfections were performed in duplicate and repeated 4–6 times.
Figure 4
Figure 4. TRβ interacts with PGC-1β
A, GST pulldown assay using equal amounts of GST, GST PGC-1β or GST PGC-1α and S35-methionine TRβ was conducted in the presence or absence of T3 (1 μM). After the pulldown using GST sepharose beads, proteins were run on a 12% SDS PAGE and detected autoradiographically. B, A GST pulldown assay using GST, GST PGC-1β or GST PGC-1α and His-TRβ in the presence of T3 was conducted. After the pulldown and electrophoresis, the TRβ was detected by Western blot analysis. C, Mammalian two hybrid assays were conducted by cotransfecting Gal4-TRβ and PGC-1β-VP16 vectors into HepG2 cells. The Gal4X5 SV40-luciferase was the reporter gene. T3 was added at a concentration of 10 nM. All transfections were repeated in duplicate five times.
Figure 5
Figure 5. PGC-1β is associated with CPT-Iα gene in vivo
HepG2 cells were transfected with 4 μg CPT-Iα luc and 4 μg of Flag tagged PGC-1β. ChIP assays were performed by crosslinking cells with 1% formaldehyde as described in the “Materials and Methods”. Antibodies against Flag or IgG were used for immunoprecipitations. Primers amplifying regions of the first intron, the CPT-Iα TRE, or the upstream region were used (Table II). The amplified PCR products were resolved on agarose gels.
Figure 6
Figure 6. CBP and PGC-1α are associated with the CPT-Iα gene in vivo
A, HepG2 cells were transfected with CPT-Iα luciferase vectors, RSV-TRβ, TK-renilla and an expression vector for CBP as described in the legend to figure 1. Cells were treated with 100 nM T3 for 24 hours and then harvested as described in the materials and methods. All transfections were conducted four times in duplicate. B, Chromatin immunoprecipitation assays (ChIP) were conducted on primary rat hepatocytes. Hepatocytes were treated with 100 nM thyroid hormone (T3) for 6 hrs and then cross-linked with 1% formaldehyde as described in the materials and methods. Antibodies to PGC-1α, CBP or immunoglobin G (IgG) were used for immunoprecipitations. The amplified PCR products using primers for the first intron, the CPT-Iα TRE and upstream region of the CPT-Iα gene were resolved on an agarose gel. C, The association of PGC-1α and CBP with the CPT-Iα TRE and first intron were quantitated. These data are the average ± standard error of three independent ChIP assays.
Figure 7
Figure 7. Knock-down of PGC-1 isoforms alters CPT-Iα luciferase expression
A. McA-RH7777 cells were transfected with 0.5 μg CPT-Iα luc, 100 ng CMV-TRβ and 1 μg of pSilencer, pSilencer with a scrambled control (NC) or pSilencer with siRNA for PGC-1α or PGC-1β essentially as described in Figure 1. All transfections were conducted in duplicate and repeated four times. The data are expressed as the average luciferase activity relative to the controls. The p< 0.01 for the siRNA knock-down is indicated by the asterisk. B. The pSilencer vectors were transfected into HepG2 cells with either Flag-PGC-1α or PGC-1β expression vectors. The expression of PGC-1α or PGC-1β was monitored by Western blot analysis with the Flag antibody (1:1000, Sigma).

Similar articles

Cited by

References

    1. McGarry JD, Brown NF. The mitochondrial carnitine palmitoyltransferase system. From concept to molecular analysis. Eur J Biochem. 1997;244:1–14. - PubMed
    1. Cook GA, Park EA. Expression and regulation of carnitine palmitoyltransferase-Ialpha and -Ibeta genes. Am J Med Sci. 1999;318:43–8. - PubMed
    1. Price N, van der Leij F, Jackson V, Corstorphine C, Thomson R, Sorensen A, Zammit V. A novel brain-expressed protein related to carnitine palmitoyltransferase I. Genomics. 2002;80:433–42. - PubMed
    1. Jansen MS, Cook GA, Song S, Park EA. Thyroid hormone regulates carnitine palmitoyltransferase Ialpha gene expression through elements in the promoter and first intron. J Biol Chem. 2000;275:34989–97. - PubMed
    1. Park EA, Mynatt RL, Cook GA, Kashfi K. Insulin regulates enzyme activity, malonyl-CoA sensitivity and mRNA abundance of hepatic carnitine palmitoyltransferase-I. Biochem J. 1995;310 (Pt 3):853–8. - PMC - PubMed

Publication types

MeSH terms

Substances

LinkOut - more resources