

Differential dysfunction in dendritic cell subsets during chronic HCV infection
- PMID: 17239662
- PMCID: PMC1865520
- DOI: 10.1016/j.clim.2006.12.001
Differential dysfunction in dendritic cell subsets during chronic HCV infection
Abstract
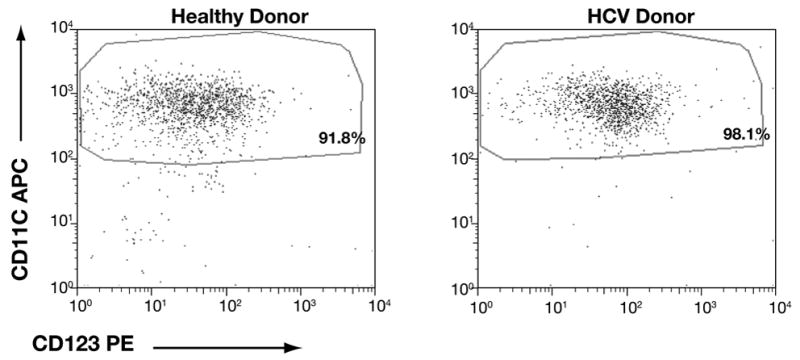
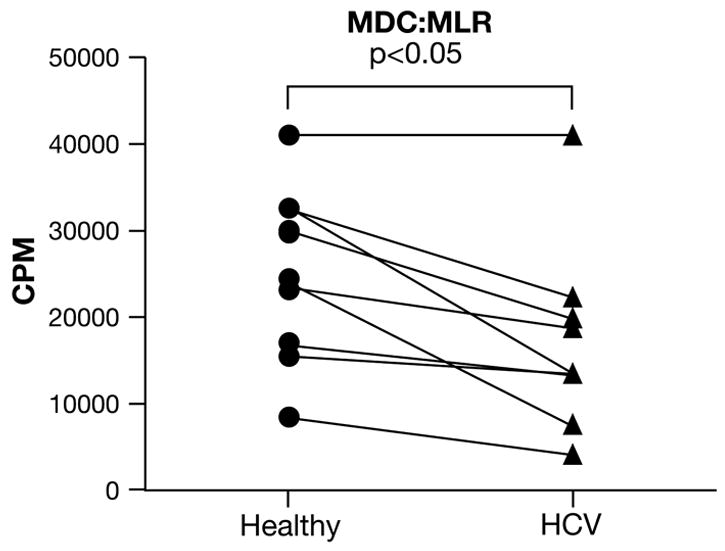
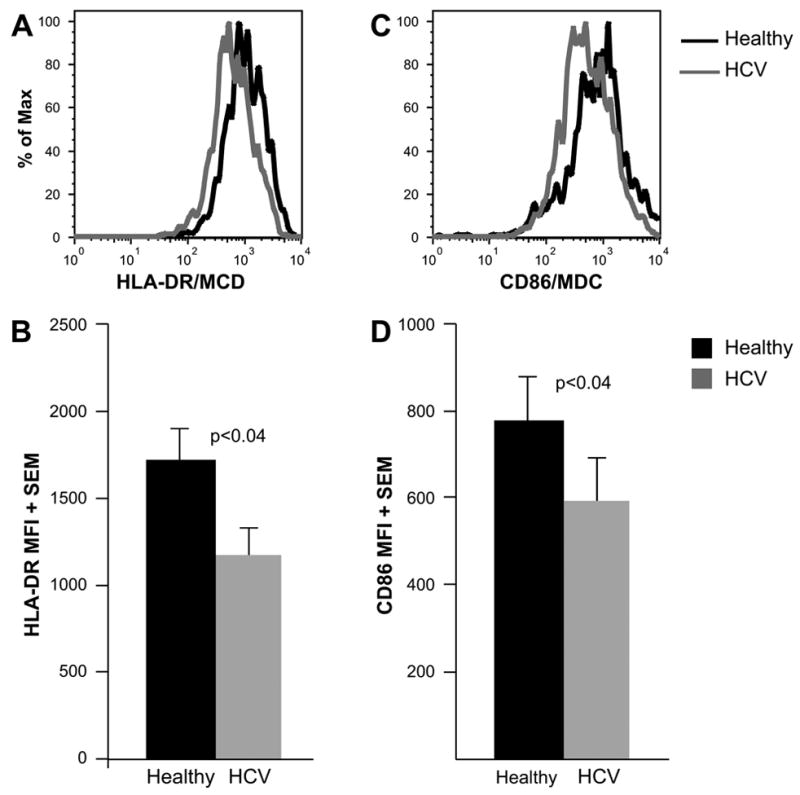
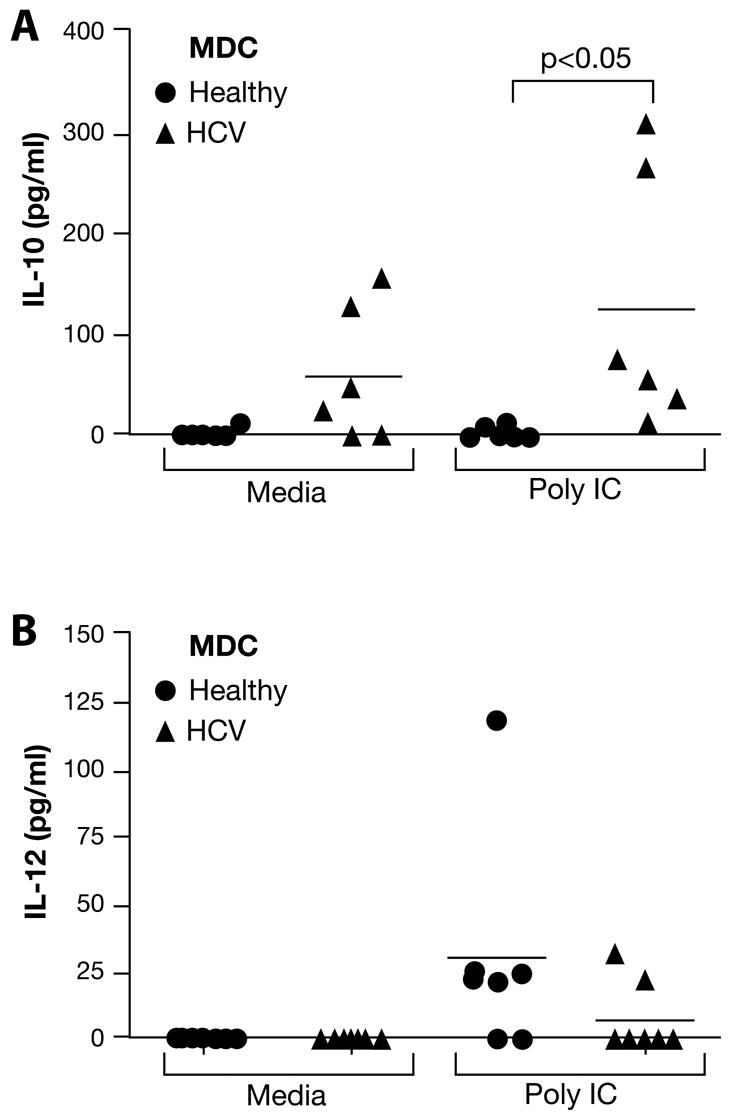
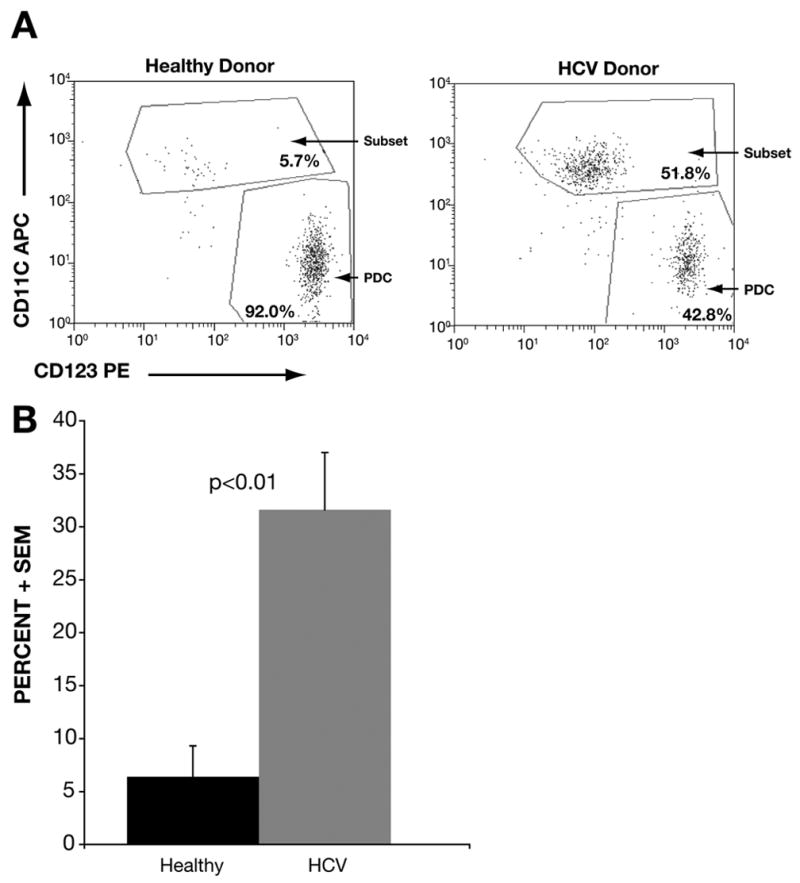
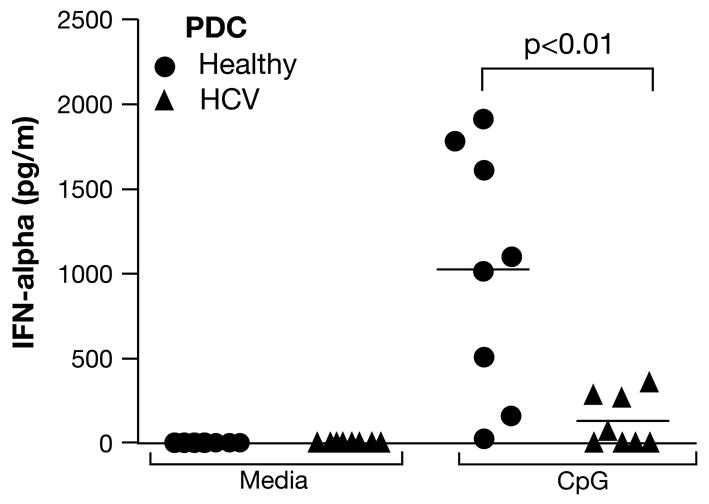
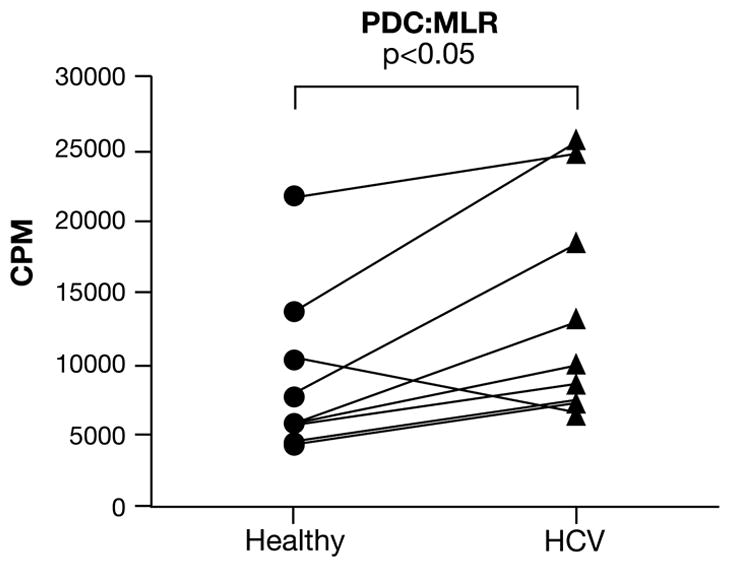
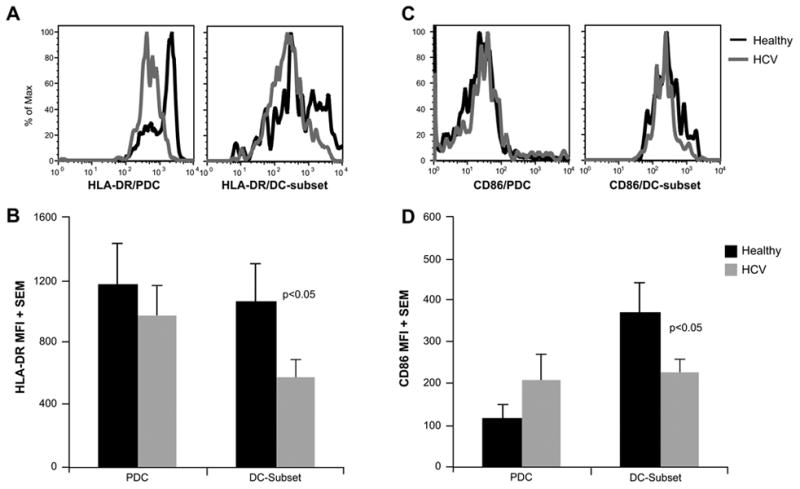
Hepatitis C virus (HCV) infection is a leading cause of chronic liver disease with over 200 million individuals infected worldwide. The vast majority of acutely infected humans develop chronic infection, which is characterized by attenuated antiviral T-cell responses. The mechanisms leading to such attenuation/suppression are poorly understood. It has been proposed that dysfunction of antigen-presenting cells (APC) may underlie the downregulation of antiviral immune responses. However, studies using bulk or in vitro-derived APC populations have resulted in conflicting reports. In this study, we evaluated the functional and immunophenotypic features of ex vivo-purified dendritic cell (DC) subsets during chronic HCV infection. We found that plasmacytoid DC (PDC) from HCV-infected patients (HCV-PDC) showed a striking deficit in IFN-alpha production in response to CpG stimulation. In addition, we found that myeloid DC (MDC) from these patients showed a diminished capacity to induce a mixed lymphocyte response (MLR), correlating with lower levels of HLA-DR and CD86 expression and higher IL-10 production in response to poly-IC stimulation. In contrast, HCV-PDC showed increased ability to stimulate an MLR. Of note, within the HCV-PDC preparation, we noted a distinctly expanded DC subset that expressed some markers of MDC, but showed significantly lower HLA-DR and CD86 expression, suggesting an expansion of DC at an immature/intermediate stage of differentiation. Our studies demonstrate distinct and contrasting dysfunctional features in DC subsets and underscore the importance of evaluating APC subpopulations separately.
Figures
Similar articles
-
TLR ligand-dependent activation of naive CD4 T cells by plasmacytoid dendritic cells is impaired in hepatitis C virus infection.J Immunol. 2007 Apr 1;178(7):4436-44. doi: 10.4049/jimmunol.178.7.4436. J Immunol. 2007. PMID: 17372001
-
Monocyte-derived dendritic cells from chronic HCV patients are not infected but show an immature phenotype and aberrant cytokine profile.Liver Int. 2007 Sep;27(7):944-53. doi: 10.1111/j.1478-3231.2007.01507.x. Liver Int. 2007. PMID: 17696933
-
Human herpesvirus 6B induces phenotypic maturation without IL-10 and IL-12p70 production in dendritic cells.Scand J Immunol. 2010 Jun;71(6):431-9. doi: 10.1111/j.1365-3083.2010.02389.x. Scand J Immunol. 2010. PMID: 20500695
-
Dendritic Cells in the Context of Human Tumors: Biology and Experimental Tools.Int Rev Immunol. 2016;35(2):116-35. doi: 10.3109/08830185.2015.1096935. Int Rev Immunol. 2016. PMID: 27007190 Review.
-
Dendritic cells: The warriors upfront-turned defunct in chronic hepatitis C infection.World J Hepatol. 2015 Sep 8;7(19):2202-8. doi: 10.4254/wjh.v7.i19.2202. World J Hepatol. 2015. PMID: 26380045 Free PMC article. Review.
Cited by
-
Acute Liver Damage Associated with Innate Immune Activation in a Small Nonhuman Primate Model of Hepacivirus Infection.J Virol. 2016 Sep 29;90(20):9153-62. doi: 10.1128/JVI.01051-16. Print 2016 Oct 15. J Virol. 2016. PMID: 27489267 Free PMC article.
-
Differential regulation of toll-like receptor-2, toll-like receptor-4, CD16 and human leucocyte antigen-DR on peripheral blood monocytes during mild and severe dengue fever.Immunology. 2010 Jun;130(2):202-16. doi: 10.1111/j.1365-2567.2009.03224.x. Epub 2010 Jan 27. Immunology. 2010. PMID: 20113369 Free PMC article.
-
Regulation of host innate immunity by hepatitis C virus: crosstalk between hepatocyte and NK/DC.Rev Infect. 2010 Jul 1;1(3):151-157. Rev Infect. 2010. PMID: 24688607 Free PMC article.
-
Immune evasion during foot-and-mouth disease virus infection of swine.Immunol Rev. 2008 Oct;225(1):85-95. doi: 10.1111/j.1600-065X.2008.00672.x. Immunol Rev. 2008. PMID: 18837777 Free PMC article. Review.
-
Poly(I:C) and lipopolysaccharide innate sensing functions of circulating human myeloid dendritic cells are affected in vivo in hepatitis C virus-infected patients.J Virol. 2007 Jun;81(11):5537-46. doi: 10.1128/JVI.01741-06. Epub 2007 Mar 21. J Virol. 2007. PMID: 17376921 Free PMC article.
References
-
- Neumann-Haefelin C, Blum HE, Chisari FV, Thimme R. T cell response in hepatitis C virus infection. J Clin Virol. 2005;32:75–85. - PubMed
-
- National Institutes of Health Consensus Development Conference Statement. Management of hepatitis C: 2002--June 10–12, 2002. Hepatology. 2002;36:S3–20. - PubMed
-
- Missale G, Bertoni R, Lamonaca V, Valli A, Massari M, Mori C, Rumi MG, Houghton M, Fiaccadori F, Ferrari C. Different clinical behaviors of acute hepatitis C virus infection are associated with different vigor of the anti-viral cell-mediated immune response. J Clin Invest. 1996;98:706–14. - PMC - PubMed
Publication types
MeSH terms
Substances
Grants and funding
LinkOut - more resources
Full Text Sources
Research Materials
