

Greater cortical gray matter density in lithium-treated patients with bipolar disorder
- PMID: 17240360
- PMCID: PMC3586797
- DOI: 10.1016/j.biopsych.2006.10.027
Greater cortical gray matter density in lithium-treated patients with bipolar disorder
Abstract
Background: The neurobiological underpinnings of bipolar disorder are not well understood. Previous neuroimaging findings have been inconsistent; however, new methods for three-dimensional (3-D) computational image analysis may better characterize neuroanatomic changes than standard volumetric measures.
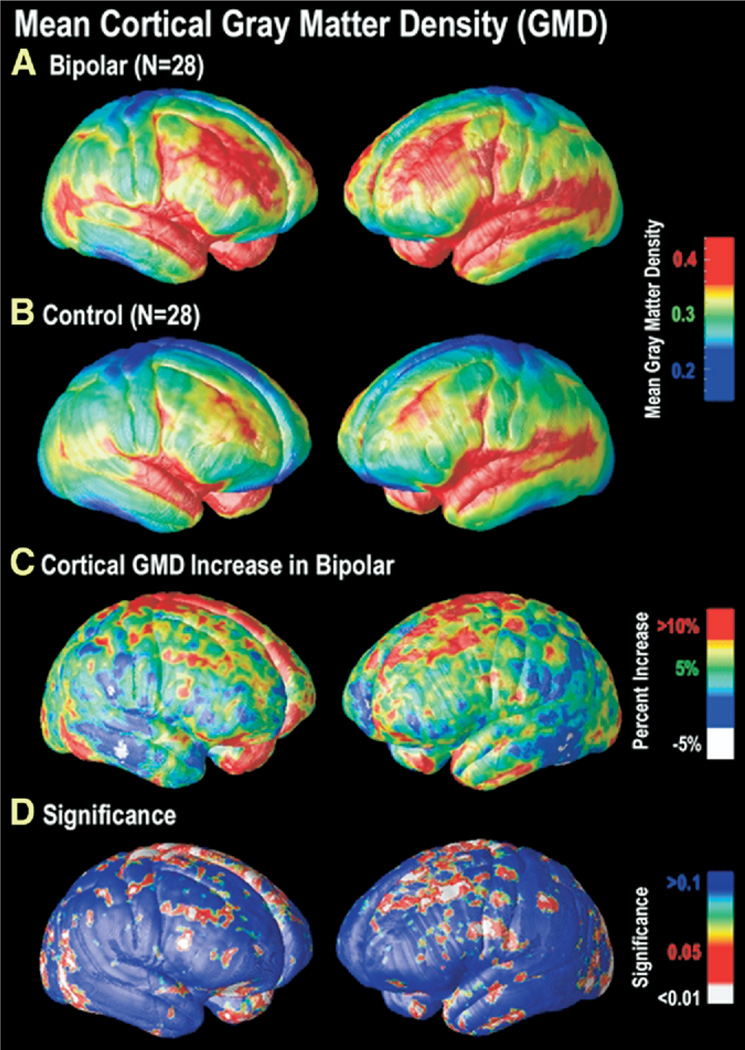
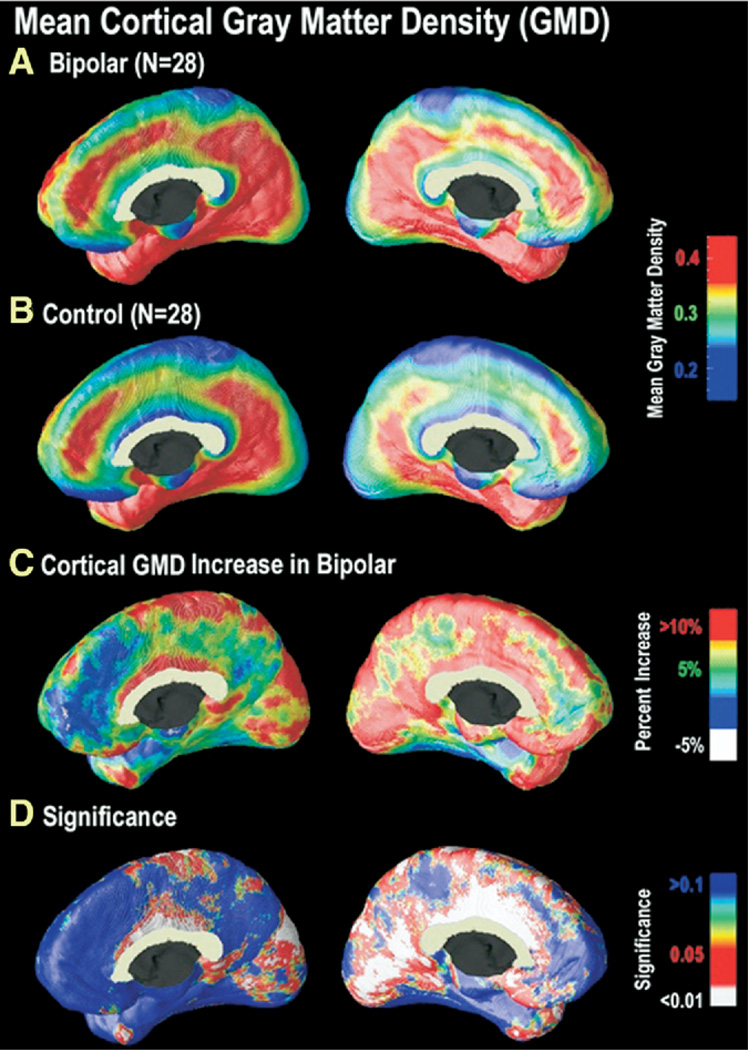
Methods: We used high-resolution magnetic resonance imaging and cortical pattern matching methods to map gray matter differences in 28 adults with bipolar disorder, 70% of whom were lithium-treated (mean age = 36.1 +/- 10.5; 13 female subject), and 28 healthy control subjects (mean age = 35.9 +/- 8.5; 11 female subjects). Detailed spatial analyses of gray matter density (GMD) were conducted by measuring local proportions of gray matter at thousands of homologous cortical locations.
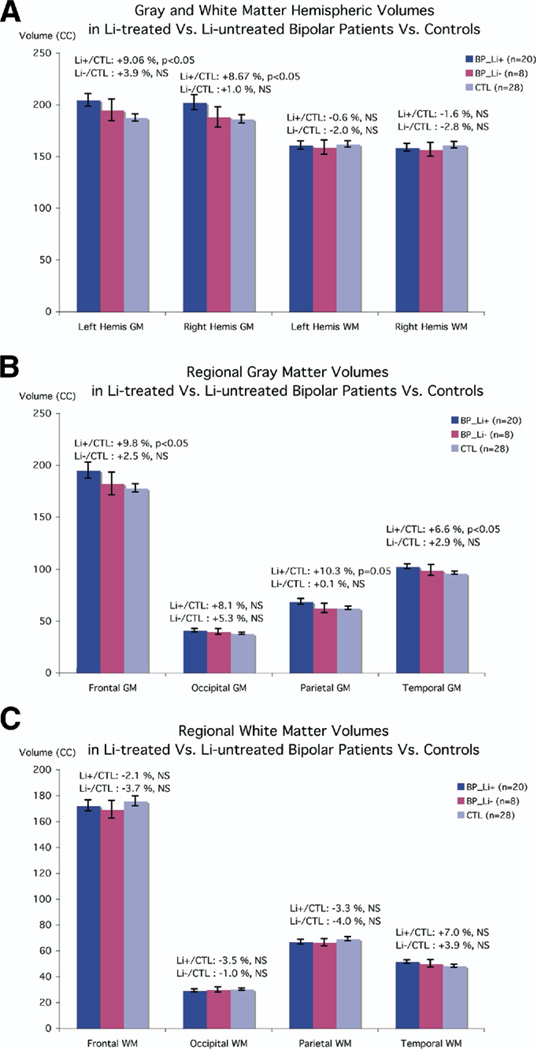
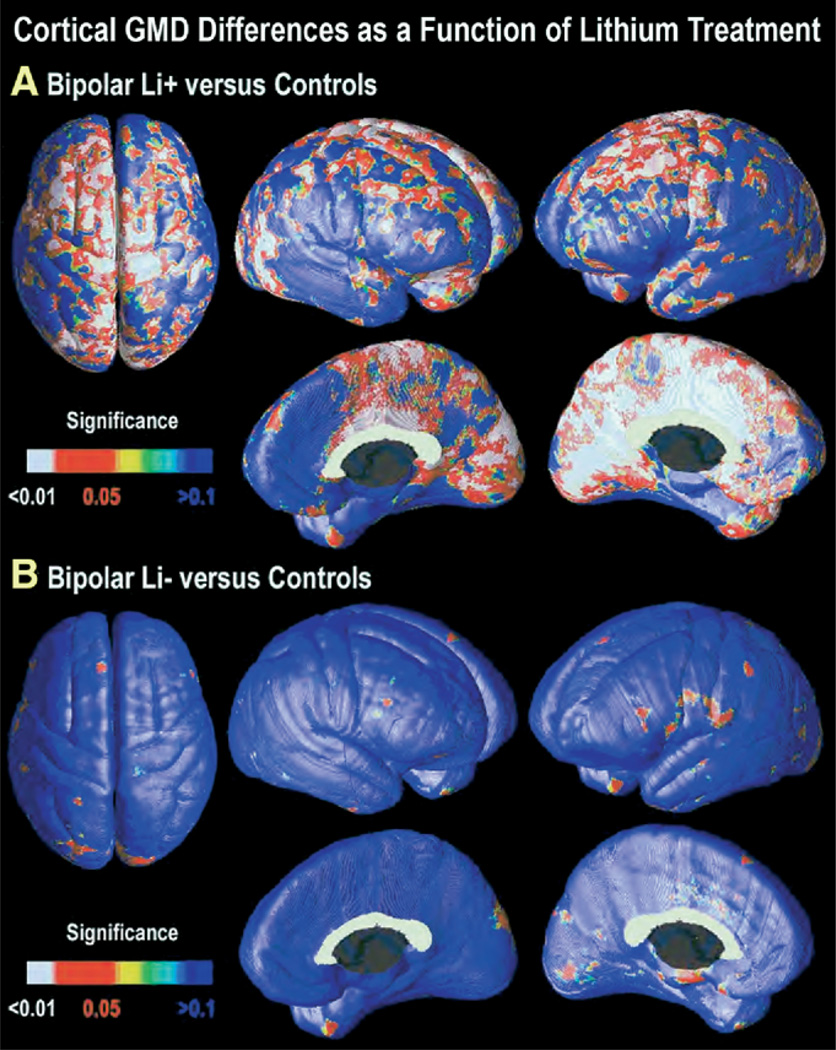
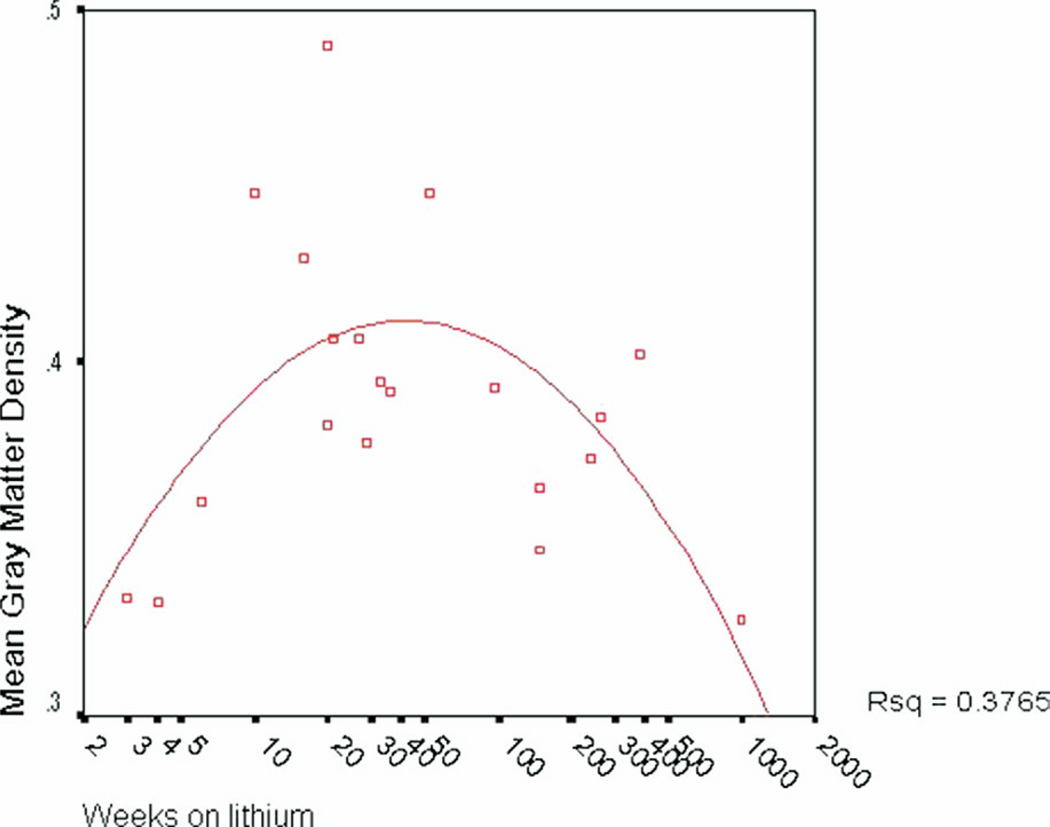
Results: Gray matter density was significantly greater in bipolar patients relative to control subjects in diffuse cortical regions. Greatest differences were found in bilateral cingulate and paralimbic cortices, brain regions critical for attentional, motivational, and emotional modulation. Secondary region of interest (ROI) analyses indicated significantly greater GMD in the right anterior cingulate among lithium-treated bipolar patients (n = 20) relative to those not taking lithium (n = 8).
Conclusions: These brain maps are consistent with previous voxel-based morphometry reports of greater GMD in portions of the anterior limbic network in bipolar patients and suggest neurotrophic effects of lithium as a possible etiology of these neuroanatomic differences.
Figures
Comment in
-
In search of the Holy Grail for the treatment of neurodegenerative disorders: has a simple cation been overlooked?Biol Psychiatry. 2007 Jul 1;62(1):4-6. doi: 10.1016/j.biopsych.2007.04.008. Biol Psychiatry. 2007. PMID: 17572175 Free PMC article. Review. No abstract available.
-
Lithium and increased cortical gray matter-more tissue or more water?Biol Psychiatry. 2008 Feb 1;63(3):e17; author reply e19. doi: 10.1016/j.biopsych.2007.04.044. Epub 2007 Jul 9. Biol Psychiatry. 2008. PMID: 17617383 No abstract available.
References
-
- Adler C, Levine A, DelBello M, Strakowski S. Changes in gray matter volume in patients with bipolar disorder. Biol Psychiatry. 2005;58:151–157. - PubMed
-
- Ashburner J, Friston KJ. Voxel-based morphometry—the methods. Neuroimage. 2000;11:805–821. - PubMed
-
- Ballmaier M, Sowell ER, Thompson PM, Kumar A, Narr KL, Lavretsky H, et al. Mapping brain size and cortical gray matter changes in elderly depression. Biol Psychiatry. 2004;55(4):382–389. - PubMed
-
- Bech P, Bolwig TG, Kramp P, Rafaelsen OJ. The Bech-Rafaelsen Mania Scale and the Hamilton Depression Scale. Acta Psychiatr Scand. 1979;59:420–430. - PubMed
-
- Bell EC, Willson MC, Wilman AH, Dave S, Silverstone PH. Differential effects of chronic lithium and valproate on brain activation in healthy volunteers. Hum Psychopharmacol. 2005;20:415–424. - PubMed
Publication types
MeSH terms
Substances
Grants and funding
- K23 MH074644/MH/NIMH NIH HHS/United States
- P30 MH030915/MH/NIMH NIH HHS/United States
- R01 MH029618/MH/NIMH NIH HHS/United States
- MH29618/MH/NIMH NIH HHS/United States
- R21 RR019771/RR/NCRR NIH HHS/United States
- K24 RR020571/RR/NCRR NIH HHS/United States
- MH030915/MH/NIMH NIH HHS/United States
- EB01651/EB/NIBIB NIH HHS/United States
- R01 EB016516/EB/NIBIB NIH HHS/United States
- MH068662/MH/NIMH NIH HHS/United States
- K23 MH074644-01/MH/NIMH NIH HHS/United States
- R37 MH029618/MH/NIMH NIH HHS/United States
- AG021431/AG/NIA NIH HHS/United States
- R01 MH068766/MH/NIMH NIH HHS/United States
- RR020571/RR/NCRR NIH HHS/United States
- R01 AG021431/AG/NIA NIH HHS/United States
- RR019771/RR/NCRR NIH HHS/United States
- MH01736/MH/NIMH NIH HHS/United States
- K23 MH001736/MH/NIMH NIH HHS/United States
- MH068766/MH/NIMH NIH HHS/United States
- P20 MH068662/MH/NIMH NIH HHS/United States
- P30 MH086045/MH/NIMH NIH HHS/United States
