. 2007 Jan 30;23(3):1292-9.
doi: 10.1021/la062455t.

Curvature effect on the structure of phospholipid bilayers

Affiliations

Curvature effect on the structure of phospholipid bilayers

Norbert Kucerka et al. Langmuir. .

Abstract

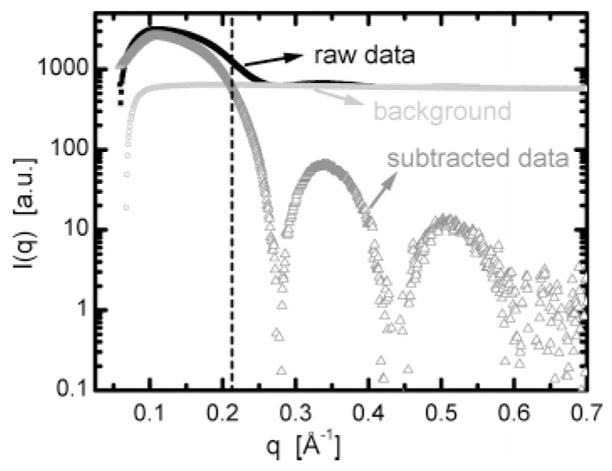
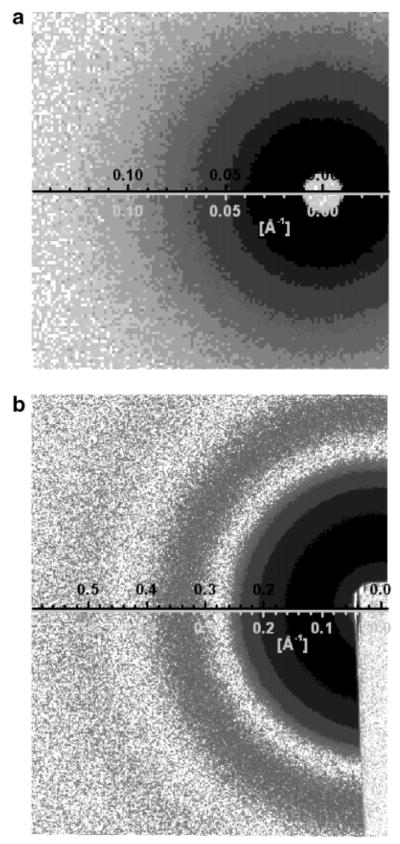
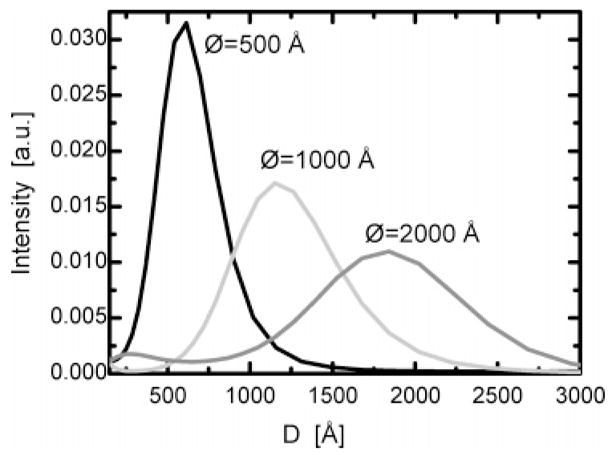
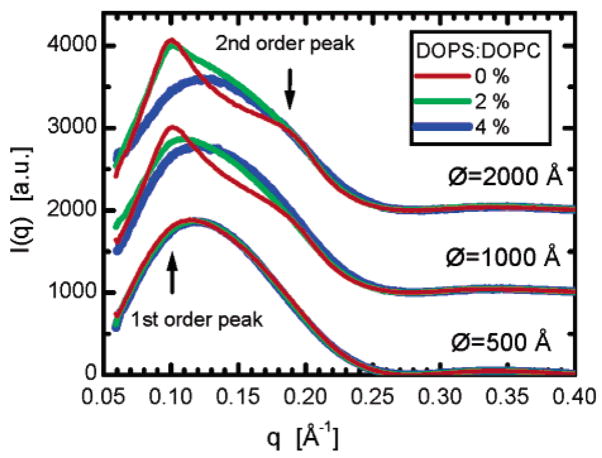
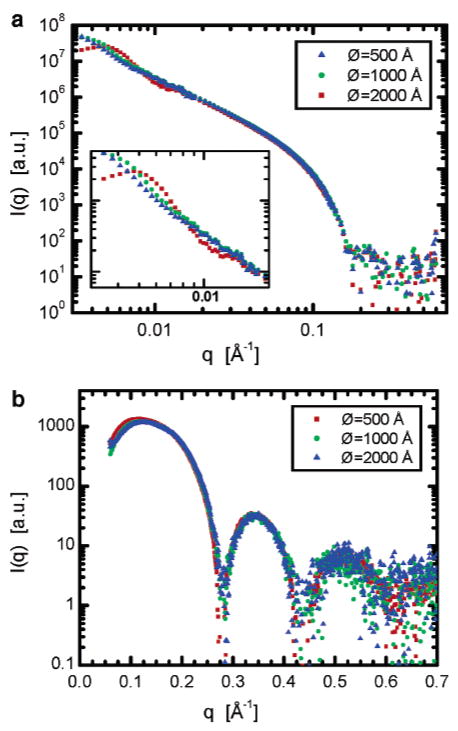
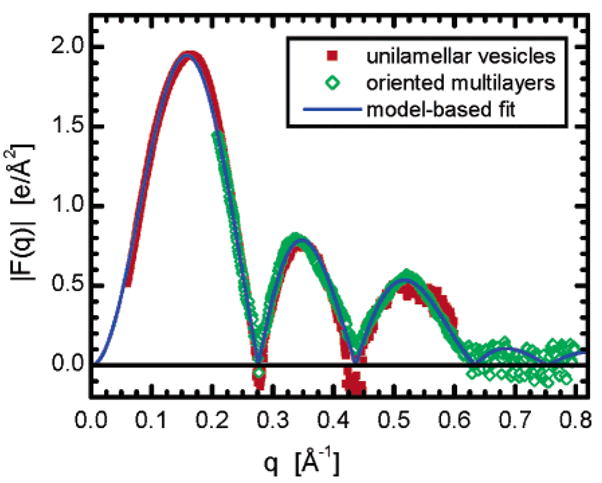
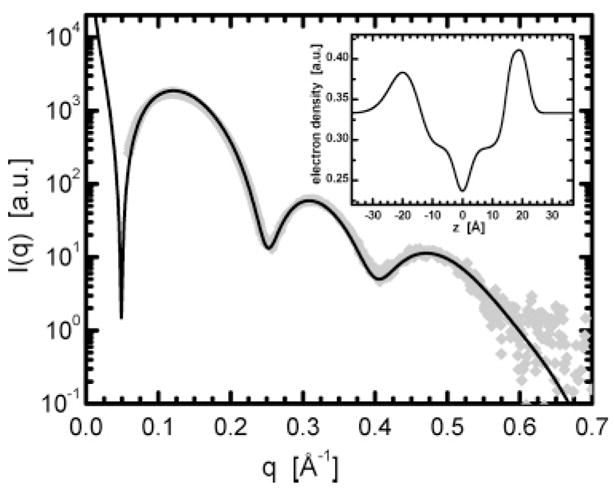
High-resolution small-angle X-ray scattering (SAXS), complemented by small-angle neutron scattering (SANS) and dynamic light scattering (DLS) experiments, was used to study the effect of curvature on the bilayer structure of dioleoyl-phosphatidylcholine (DOPC) and dioleoyl-phosphatidylserine (DOPS) unilamellar vesicles (ULVs). Bilayer curvature, as a result of finite vesicle size, was varied as a function of vesicle radius and determined by DLS and SANS measurements. Unilamellarity of large DOPC ULVs was achieved by the addition of small amounts (up to 4 mol %) of the charged lipid, DOPS. A comparison of SANS data over the range of 0.02 < q <0.2 A-1 indicated no change in the overall bilayer thickness as a function of ULV diameter (620 to 1840 A). SANS data were corroborated by high-resolution (0.06 < q <0.6 A-1) SAXS data for the same diameter ULVs and data obtained from planar samples of aligned bilayers. Both the inner and outer leaflets of the bilayer were found to be indistinguishable. This observation agrees well with simple geometric models describing the effect of vesicle curvature. However, 1220-A-diameter pure DOPS ULVs form asymmetric bilayers whose structure can most likely be rationalized in terms of geometrical constraints coupled with electrostatic interactions, rather than curvature alone.


Figures

Figure 1
Figure 1
Radially averaged scattering intensities of raw SAXS data from ULVs dispersed in water (dark squares), background scattering from water and the associated sample environment (light circles), and the ULV background-subtracted data (gray triangles). The vertical dashed line demarcates the region where scattering from ULVs dominates (q less than ~0.2 Å−1).
Figure 2
Figure 2
(a) Gray scale plot of background-subtracted SANS data taken at an SDD of 4 m; mid-q range data are obtained at this distance. The white spot at the graph’s origin is a result of the beam stop. (b) Gray scale plot of background-subtracted SAXS data. Three distinct darker regions corresponding to the locally maximal intensities are interspersed among the light minima. The rectangular light region in the lower right-hand corner is the absorption from the beam stop.
Figure 3
Figure 3
Size distribution functions corresponding to the three extruded ULV systems. The peaks, although getting broader with increasing mean value, have the same relative polydispersity of 25%. Values for the two smaller ULVs are shifted toward larger sizes (620 and 1210 Å) than the filter pore size. However, the peak corresponding to the largest nominal ULV is shifted toward a smaller ULV diameter (1840 Å).
Figure 4
Figure 4
SAXS curves arising from extruded vesicles containing different DOPS/DOPC molar ratios (pure DOPC, red lines; 2% DOPS, green lines; 4% DOPS, blue lines). Curves corresponding to systems with same diameter vesicles are grouped together and shifted vertically. Two arrows point to the q values where the first-and second-order Bragg peaks are expected.
Figure 5
Figure 5
(a) SANS scattering curves collected with samples of different nominal size ULVs (DOPS/DOPC of 4 mol %). Red squares correspond to ULVs extruded through a 500 Å filter pore; green circles, 1000 Å; and blue triangles, 2000 Å. The distribution functions of the actual size ULVs are shown in Figure 3. (b) SAXS scattering curves collected with samples of different nominal size ULVs. Red squares correspond to the DOPC ULV system extruded through a 500 Å pore filter, and green circles and blue triangles correspond to ULVs made from a DOPS/DOPC mixture at 4 mol % and extruded through 1000 and 2000 Å filters, respectively. The actual ULV size distributions were determined by DLS, and the data are shown in Figure 3.
Figure 6
Figure 6
Form factors for 620-Å-diameter ULVs (red squares) and oriented multibilayers (open green diamonds), both made up of pure DOPC. The blue line is a best fit to the data and corresponds to the bilayer structure presented previously by Kučerka et al. Negative values for |F(q)| are the result of poor counting statistics as the form factor approaches zero.
Figure 7
Figure 7
SAXS data from nominal 1000 Å extruded DOPS ULVs. Note that unlike the scattering from DOPC ULVs (Figure 5b) the first and second minima do not decay to zero intensity, suggesting the presence of an asymmetric bilayer. The inset shows the resultant 1D electron density profile obtained from the best fit to the data.

References

    1. Balgavý P, Dubničková M, Kučerka N, Kiselev MA, Yaradaikin SP, Uhríková D. Biochim Biophys Acta. 2001;1512:40–52. - PubMed
    1. Katsaras J, Gutberlet T. Lipid Bilayers: Structure and Interactions. Springer-Verlag; New York: 2001.
    1. Krueger S, Ankner JF, Satija SK, Majkrzak CF, Gurley D, Colombini M. Langmuir. 1995;11:3218–3222.
    1. Liu Y, Nagle JF. Phys Rev E. 2004;69:040901. - PMC - PubMed
    1. Wong JY, Majewski J, Seitz M, Park CK, Israelachvili JN, Smith GS. Biophys J. 1999;77:1445–1457. - PMC - PubMed

Publication types