. 2007 Apr;27(7):2687-97.
doi: 10.1128/MCB.00493-06. Epub 2007 Jan 22.

TAL-1/SCL and its partners E47 and LMO2 up-regulate VE-cadherin expression in endothelial cells

Affiliations

TAL-1/SCL and its partners E47 and LMO2 up-regulate VE-cadherin expression in endothelial cells

Virginie Deleuze et al. Mol Cell Biol. 2007 Apr.

Abstract

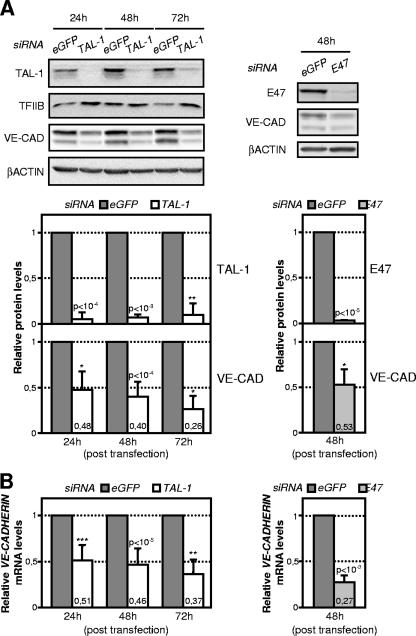
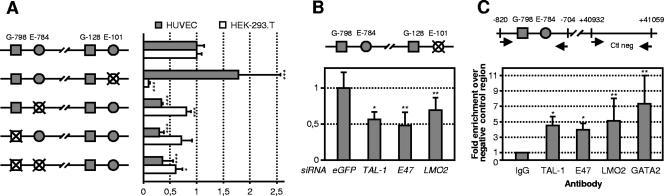
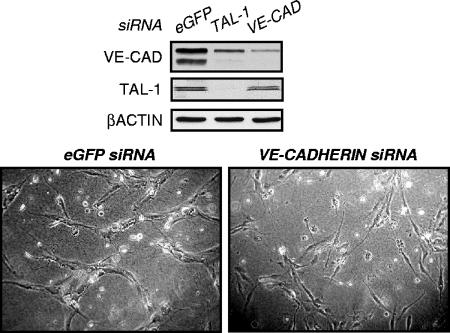
The basic helix-loop-helix TAL-1/SCL essential for hematopoietic development is also required during vascular development for embryonic angiogenesis. We reported that TAL-1 acts positively on postnatal angiogenesis by stimulating endothelial morphogenesis. Here, we investigated the functional consequences of TAL-1 silencing in human primary endothelial cells. We found that TAL-1 knockdown caused the inhibition of in vitro tubulomorphogenesis, which was associated with a dramatic reduction in vascular endothelial cadherin (VE-cadherin) at intercellular junctions. Consistently, silencing of TAL-1 as well as of its cofactors E47 and LMO2 down-regulated VE-cadherin at both the mRNA and the protein level. Endogenous VE-cadherin transcription could be activated in nonendothelial HEK-293 cells by the sole concomitant ectopic expression of TAL-1, E47, and LMO2. Transient transfections in human primary endothelial cells derived from umbilical vein (HUVECs) demonstrated that VE-cadherin promoter activity was dependent on the integrity of a specialized E-box associated with a GATA motif and was maximal with the coexpression of the different components of the TAL-1 complex. Finally, chromatin immunoprecipitation assays showed that TAL-1 and its cofactors occupied the VE-cadherin promoter in HUVECs. Together, these data identify VE-cadherin as a bona fide target gene of the TAL-1 complex in the endothelial lineage, providing a first clue to TAL-1 function in angiogenesis.


Figures

FIG. 1.
FIG. 1.
TAL-1 knockdown impairs in vitro morphogenesis. (A and B) TAL-1 silencing does not affect EC survival or growth. HUVECs or UCB-ECs transfected with TAL-1 or control siRNA (eGFP) were tested for their proliferative properties. (A) (Left) TAL-1 expression was assessed in whole-cell lysates (30 μg) by immunoblotting with the anti-TAL-1 MAb. The blot was reprobed with an anti-TFIIB antibody to control protein loading. (Right) Cells were transfected with the indicated siRNAs. MTT assays were carried out 48 h after the second transfection. Each bar is the mean ± SD of cell numbers relative to numbers of control siRNA-treated cells from three independent experiments performed in sextuplicate. NT, not transfected. (B) Forty-eight hours posttransfection, the same numbers of cells were seeded onto gelatin-coated coverslips. Shown are phase-contrast microscopic photographs after 24 h of culture, taken using a 10× objective. The experiments were repeated at least three times with similar results. (C) TAL-1 knockdown affects in vitro angiogenesis. HUVECs were transfected with TAL-1 or control eGFP siRNA and analyzed 24 h after the second transfection for their ability to produce in vitro capillary-like structures in 2D Matrigel culture or a tubular network in 3D collagen I gel. Shown are phase-contrast microscopic photographs, taken using a 10× objective, after 24 h of culture on Matrigel (left) or after 48 h in collagen I gel (right). The experiments were repeated at least three times with similar results.
FIG. 2.
FIG. 2.
TAL-1 or E47 knockdown disrupts junctional VE-cadherin distribution. HUVECs were transfected with the indicated siRNA and, 24 h posttransfection, were trypsinized and seeded onto coverslips overnight. Cells were stained for VE-cadherin, PECAM, β-catenin, and N-cadherin, and the nuclei were counterstained. Micrographs were taken using a 40× objective. The pictures are representative of at least three independent experiments. Bar, 20 μM.
FIG. 3.
FIG. 3.
VE-cadherin expression is down-regulated in TAL-1- or E47-silenced ECs. HUVECs were transfected with the indicated siRNA. Whole-cell extracts and total RNAs were prepared at the indicated time points after transfection and monitored for VE-cadherin (VE-CAD) expression. (A) TAL-1, E47, and intracellular VE-cadherin protein expression levels were analyzed by immunoblotting. β-Actin or TFIIB expression was monitored for normalization of protein loading. Protein content from control siRNA-treated cells was arbitrarily set at 1. The images (top) are representative of three independent experiments, and the means ± SD of the indicated protein relative to that of β-actin are shown (bottom). (B) VE-cadherin mRNA levels were analyzed by RT-qPCR. The signals of VE-cadherin mRNA were normalized to that of GAPDH (gene encoding glyceraldehyde-3-phosphate dehydrogenase). Data shown are the means ± SD from three independent experiments. The VE-cadherin mRNA content from control siRNA-treated cells was arbitrarily set at 1.
FIG. 4.
FIG. 4.
LMO-2 activity correlates with VE-cadherin up-regulation. (A) Time course analysis of TAL-1, VE-cadherin, and LMO-2 mRNA expression during in vitro angiogenesis. HUVECs were plated on Matrigel and cultured for 24 h. Cells were recovered at the indicated time points to prepare total RNA. Gene expression was analyzed by RT-qPCR. The signals of TAL-1, VE-cadherin, and LMO-2 mRNAs were normalized to that of GAPDH (gene encoding glyceraldehyde-3-phosphate dehydrogenase). Data shown are mRNA levels relative to the corresponding mRNA levels of exponentially growing cells, which were assigned a value of 1. Results from two independent experiments (Exp. 1 and Exp. 2) are shown. (B) LMO-2 silencing down-regulates VE-cadherin expression. HUVECs were transfected with control or LMO-2 siRNA. Forty-eight hours posttransfection, VE-cadherin protein expression was analyzed by immunoblotting; β-actin expression was used to normalize protein loading. The image (middle) is representative of at least three independent experiments. Data shown are VE-cadherin protein contents relative to that of control siRNA-treated cells, which was assigned a value of 1 (bottom). LMO-2 silencing (top) and VE-cadherin mRNA expression were monitored by RT-qPCR, and mRNA signals were normalized to that of GAPDH. Data shown are mRNA contents relative to that of control siRNA-treated cells, which was assigned a value of 1 (**, P < 0.01; ***, P < 0.001). (C) Ectopic coexpression of TAL-1, E47, and LMO-2 up-regulates VE-cadherin expression in nonendothelial cells. HEK-293 cells were cotransfected with the indicated expression vectors. The total amount of DNA (6.5 μg) was maintained constant with the addition of the corresponding empty vectors. eGFP vector (0.5 μg) was added to each point to control transfection efficiency. Total RNAs and whole-cell extracts were prepared 48 h posttransfection, and VE-cadherin expression was analyzed by RT-qPCR. The expression of ectopic proteins in whole-cell extracts (30 μg) was monitored by immunoblotting. A representative experiment is shown. VE-cadherin mRNA signals were normalized to those of GAPDH. Data shown are VE-cadherin mRNA contents relative to that of cells transfected with empty vectors, which was assigned a value of 1. Data are the means ± SD from at least three independent experiments (***, P < 0.001).
FIG. 5.
FIG. 5.
Silencing of TAL-1, E47, or LMO2 reduces VE-cadherin promoter activity. (A) (Top) HUVECs were transfected by control or TAL-1 siRNA and 24 h later with the indicated reporter containing fragments derived from the human VE-cadherin promoter, for which the negative number indicates the position of the first nucleotide of the gene segment relative to the transcription start site (+1), or with the pGL3 promoter reporter (SV40). Luciferase activity was assayed as described previously (24). Relative luciferase activities are presented as increases (n-fold) over the activity of the minimal promoter (the −166/−5 construct) treated with control eGFP siRNA, which was assigned a value of 1. Each bar is the mean ± SD from at least three independent experiments, each performed in triplicate. TAL-1 silencing was monitored by immunoblot analysis (not shown). (Bottom) The VE-cadherin promoter contains two conserved E-box-GATA motifs. Nucleotide sequences of the two highly conserved regions from the human VE-cadherin promoter are shown. The E-boxes E−784 and E−101 are indicated by dark-gray boxes and GATA-binding sites G−798 and G−128 by light-gray boxes. The ETS-binding sites (EBS) from the minimum promoter (34) are underlined. (B) HUVECs were transfected with the indicated siRNAs and either with the −1135/−5 reporter construct (left) or with the pGL3 promoter (right). E47 silencing was monitored by immunoblot analysis and LMO2 silencing by RT-qPCR (not shown). Data are the means ± SD from at least three independent experiments, each performed in triplicate, and are shown relative to the luciferase activity of cells transfected with control siRNA. (C) HUVECs were cotransfected with the −1135/−5 reporter construct and the indicated expression vectors. The total amount of DNA was maintained constant with the addition of the corresponding empty vectors. Data are the means ± SD from at least three independent experiments, each performed in triplicate, and are shown relative to the luciferase activity of cells transfected with empty vector, which was arbitrarily set at 1 (**, P < 0.01; ***, P < 0.001). Ectopic expression was monitored by Western blot analysis or RT-qPCR (see Fig. S2 in the supplemental material).
FIG. 6.
FIG. 6.
VE-cadherin promoter activity in endothelial cells is dependent on a specialized E-box-GATA element. (A) HUVECs or HEK-293 cells were transfected with either the wild-type −1135/−5 promoter construct or the −1135/−5 promoter construct with the indicated mutation(s). Three independent clones were tested for each mutation. Data are the means ± SD from three experiments performed in triplicate and are shown relative to the luciferase activity of cells transfected with the wild-type promoter construct, which was assigned a value of 1. (***, P < 0.001; *, P < 0.05.) (B) Silencing of TAL-1, E47, or LMO2 reduces the activity of the VE-cadherin promoter in the absence of functional E−101. HUVECs were transfected by the indicated siRNA and 24 h later with the VE-cadherin −1135/−5 promoter reporter in which E−101 was mutated. Relative luciferase activities are presented as increases (n-fold) over the activity of the E−101 mutated promoter treated with control GFP siRNA, which was assigned a value of 1. Each bar is the mean ± SD from three independent experiments, each performed in triplicate. TAL-1 and E47 silencing was monitored by immunoblot analysis and LMO2 silencing by RT-qPCR (not shown). **, P < 0.01; *, P < 0.05. (C) TAL-1, E47, LMO2, and GATA-2 are recruited to the VE-cadherin promoter in HUVECs. ChIP assays were performed on cross-linked chromatin from HUVECs, as described in Materials and Methods (see the supplemental material for a detailed description). Aliquots of immunoprecipitated DNAs were analyzed in triplicate by RT-qPCR with primers targeting the G−798/E−784 region. The genomic region downstream of the VE-cadherin gene (+40932) was amplified as a negative control. Enrichment (n-fold) of target genomic regions immunoprecipitated by each specific antibody was normalized to the levels obtained with species-matched control IgGs, assigned a value of 1, and plotted as the increase over the level of enrichment at the negative-control region. The error bars represent SD from at least two independent ChIP assays. **, P < 0.01; *, P < 0.05.
FIG. 7.
FIG. 7.
Knockdown of VE-cadherin (VE-CAD) impairs in vitro tubulogenesis. HUVECs were transfected twice with the indicated siRNA and analyzed 24 h after the second transfection for their ability to produce an in vitro tubular network in 3D collagen I gel. Shown are phase-contrast microscopic photographs, taken using a 10× objective, after 48 h of culture in collagen I gel. The residual protein expression was monitored by immunoblot analysis using 30 μg whole-cell extracts. A representative experiment of three is shown.

References

    1. Anguita, E., J. Hughes, C. Heyworth, G. A. Blobel, W. G. Wood, and D. R. Higgs. 2004. Globin gene activation during haemopoiesis is driven by protein complexes nucleated by GATA-1 and GATA-2. EMBO J. 23:2841-2852. - PMC - PubMed
    1. Batlle, E., E. Sancho, C. Franci, D. Dominguez, M. Monfar, J. Baulida, and A. Garcia De Herreros. 2000. The transcription factor snail is a repressor of E-cadherin gene expression in epithelial tumour cells. Nat. Cell Biol. 2:84-89. - PubMed
    1. Carmeliet, P., M. G. Lampugnani, L. Moons, F. Breviario, V. Compernolle, F. Bono, G. Balconi, R. Spagnuolo, B. Oostuyse, M. Dewerchin, A. Zanetti, A. Angellilo, V. Mattot, D. Nuyens, E. Lutgens, F. Clotman, M. C. de Ruiter, A. Gittenberger-de Groot, R. Poelmann, F. Lupu, J. M. Herbert, D. Collen, and E. Dejana. 1999. Targeted deficiency or cytosolic truncation of the VE-cadherin gene in mice impairs VEGF-mediated endothelial survival and angiogenesis. Cell 98:147-157. - PubMed
    1. Chetty, R., M. A. Dada, C. H. Boshoff, M. A. Comley, S. C. Biddolph, J. W. Schneider, D. Y. Mason, K. A. Pulford, and K. C. Gatter. 1997. TAL-1 protein expression in vascular lesions. J. Pathol. 181:311-315. - PubMed
    1. Cohen-Kaminsky, S., L. Maouche-Chretien, L. Vitelli, M. A. Vinit, I. Blanchard, M. Yamamoto, C. Peschle, and P. H. Romeo. 1998. Chromatin immunoselection defines a TAL-1 target gene. EMBO J. 17:5151-5160. - PMC - PubMed

MeSH terms

Substances