. 2007 Mar;27(6):2309-23.
doi: 10.1128/MCB.01875-06. Epub 2007 Jan 22.

Subcellular transport of EKLF and switch-on of murine adult beta maj globin gene transcription

Affiliations

Subcellular transport of EKLF and switch-on of murine adult beta maj globin gene transcription

Yu-Chiau Shyu et al. Mol Cell Biol. 2007 Mar.

Abstract

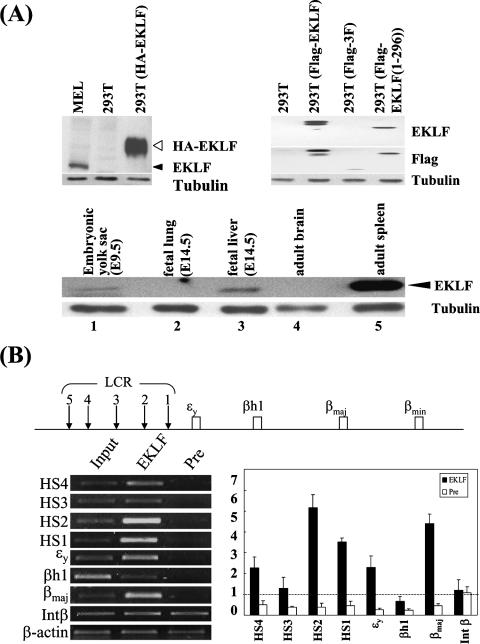
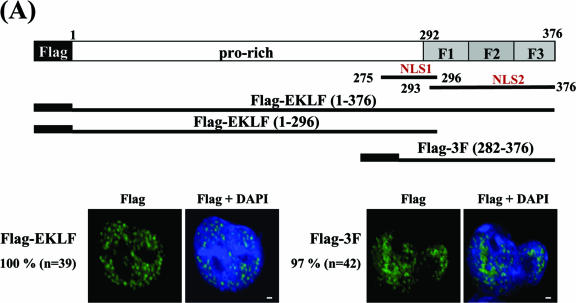
Erythroid Krüppel-like factor (EKLF) is an essential transcription factor for mammalian beta-like globin gene switching, and it specifically activates transcription of the adult beta globin gene through binding of its zinc fingers to the promoter. It has been a puzzle that in the mouse, despite its expression throughout the erythroid development, EKLF activates the adult beta(maj) globin promoter only in erythroid cells beyond the stage of embryonic day 10.5 (E10.5) but not before. We show here that expression of the mouse beta(maj) globin gene in the aorta-gonad-mesonephros region of E10.5 embryos and in the E14.5 fetal liver is accompanied by predominantly nuclear localization of EKLF. In contrast, EKLF is mainly cytoplasmic in the erythroid cells of E9.5 blood islands in which beta(maj) is silenced. Remarkably, in a cultured mouse adult erythroleukemic (MEL) cell line, the activation of the beta(maj) globin gene by dimethyl sulfoxide (DMSO) or hexamethylene-bis-acetamide (HMBA) induction is also paralleled by a shift of the subcellular location of EKLF from the cytoplasm to the nucleus. Blockage of the nuclear import of EKLF in DMSO-induced MEL cells with a nuclear export inhibitor repressed the transcription of the beta(maj) globin gene. Transient transfection experiments further indicated that the full-sequence context of EKLF was required for the regulation of its subcellular locations in MEL cells during DMSO induction. Finally, in both the E14.5 fetal liver cells and induced MEL cells, the beta-like globin locus is colocalized the PML oncogene domain nuclear body, and concentrated with EKLF, RNA polymerase II, and the splicing factor SC35. These data together provide the first evidence that developmental stage- and differentiation state-specific regulation of the nuclear transport of EKLF might be one of the steps necessary for the switch-on of the mammalian adult beta globin gene transcription.


Figures

FIG. 1.
FIG. 1.
(A) Upper panels, specificity test of the AEK-1 antibody. Left panel, AEK-1 was used to probe Western blots containing whole-cell extracts prepared from MEL cells, 293T cells, and 293T cells transfected with pHA-EKLF. As a control, the blot was also probed with antitubulin. The positions of HA-EKLF and EKLF are indicated with open and black arrowheads, respectively. Right panel, Western blot analysis of whole-cell extracts prepared from 293T cells with or without transfection with pFlag-EKLF, pFlag-EKLF (1-296), and pFlag-3F (282-376), with anti-AEK-1, anti-Flag, and antitubulin used as the probes. Note the lack of AEK-1 signals in the lanes of 293T and 293T (Flag-3F). Shown in the lower panel are the expression patterns of EKLF in the mouse tissues. Whole-cell extracts were prepared from different mouse tissues and analyzed by Western blotting using AEK-1 as the probe. Note the presence of EKLF in the extracts of E9.5 yolk sac, E14.5 fetal liver, and adult spleen (lanes 1, 3, and 5, respectively). See reference for more Western blotting data. (B) ChIP assay of β-like globin locus in murine E14.5 fetal liver. The physical map of the mouse β-like globin locus is shown on top. Shown in the lower left panel is the agarose gel pattern of PCR products from the immunoprecipitation reactions using the antibody AEK-1 (lane “EKLF”) or preimmune serum (lane “Pre”). The lane “Input” consists of PCR bands using the input DNAs as the standard. The relative intensities of the positive signals are given as the severalfold increases over those from the preimmune samples, and the severalfold differences are given as means ± standard errors of the means.
FIG. 2.
FIG. 2.
Subcellular locations of EKLF. 293T cells (top row), blood islands of E9.5 mouse yolk sacs (second row), peripheral blood cells of E10.5 AGM (third row), and E14.5 fetal liver cells (bottom row) were stained with AEK-1 and examined with the confocal microscope. The broken lines in the first column indicate the boundaries of the nuclei, as defined by the DAPI staining. Lower-magnification pictures are shown in the last column. The percentage values represent the fractions of EKLF-positive cells containing the majority of EKLF (more than 90%) in the nucleus. n values represent the numbers of cells analyzed for each set of the experiments. Each set consists of three or more independent analyses. Western blot analysis results of the nuclear (Nu) and cytoplasmic (Cyto) extracts prepared from the blood island cells of E9.5 yolk sacs, peripheral blood cells of the E10.5 AGM, and E14.5 fetal liver cells are shown in the lower panel, with tubulin as the cytoplasmic marker and hnRNP A1 as the nuclear marker.
FIG. 3.
FIG. 3.
DNA-FISH immunostaining of mouse fetal liver and yolk sac cells. Combined DNA-FISH immunostaining of cells from murine E14.5 fetal livers and blood islands of E9.5 yolk sacs was carried out using DNA probe specific for the mouse β globin locus and different antibodies. Note that the immunostaining signals after DNA FISH were usually weaker due to the step of incubation at 65°C. This was already mentioned previously in reference . (A) Colocalization of EKLF with the β globin locus in the E14.5 fetal liver but not the E9.5 yolk sac. The arrows point to the two β globin alleles in the cells shown. The diagram shows the locations of the EKLF dots (red) and the β globin alleles (green). The percentage values represent the fractions of EKLF-positive and two allele-exhibiting cells that have at least one of their β globin alleles colocalized with an EKLF dot. (B) Colocalization of the β globin locus with EKLF, POD, RNAP II factory, and SC35 speckles in the fetal liver cells. DNA FISH was combined with double immunostaining and use of the antibody pairs AEK-1/anti-PML (top row), AEK-1/N-20 (middle row), and AEK-1/anti-SC35 (bottom row). The fractions (%) of cells in which at least one β globin allele was colocalized with the pair(s) of nuclear bodies and/or RNAP II factory are indicated. n represents the numbers of cells analyzed for each set of the experiments.
FIG. 4.
FIG. 4.
Subcellular location of EKLF in MEL cells. (A) Subcellular location of the endogenous EKLF in MEL cells. The locations of EKLF in MEL cells before (top row) and after DMSO (middle row) or HMBA (bottom row) induction were examined by immunostaining with AEK-1 (first column). The nuclei were identified by DAPI staining. The fractions (%) of cells with the majority (more than 90%) of EKLF present in the nucleus are indicated. The subcellular distributions of EKLF in MEL cells were further analyzed by Western blotting of the whole-cell extract (Total), nuclear extract (Nu), and cytoplasmic extract (Cyto). Note the absence of the control tubulin bands in the “Nu” lanes. Also, most of the EKLF of MEL (+) DMSO and MEL (+) HMBA cells were in the nuclear fraction. (B) Changes of the expression levels of the βmaj globin gene and the subcellular location of EKLF during MEL differentiation. The expression levels of βmaj and G3PDH genes in MEL cells at different days after induction with DMSO were analyzed by Northern blotting. The fractions of cells containing the majority (more than 90%) of EKLF in their nuclei were also scored by immunostaining, as indicated below the Northern panel. Note the apparently concomitant appearance of βmaj RNA and the abrupt increase in the fraction of cells containing nuclear EKLF on day 2 of the induction.
FIG. 5.
FIG. 5.
Combined DNA-FISH immunostaining of MEL cells. MEL cells without (top row) and with DMSO induction for 3 days were analyzed by combined DNA-FISH immunostaining as described for Fig. 3 for the E14.5 fetal liver cells. Again, the fractions (%) of cells containing at least one β globin allele colocalized with the nuclear body and/or RNAP II factory are indicated. Note that the immunostaining signals after DNA FISH were usually weaker due to the step of incubation at 65 °C. This was also evident in the results reported in reference .
FIG. 6.
FIG. 6.
Repression of βmaj globin gene transcription by Ratjadone A-mediated blockage of the nuclear import of EKLF. (A) The subcellular locations of EKLF in MEL cells subjected to 3 days of DMSO induction with (bottom four rows) or without (first row) pretreatment with Ratjadone A were analyzed by immunostaining. Note that the Ratjadone A treatment prevented the EKLF from entering into the nucleus during DMSO induction (second row). As controls, anti-GATA-1, anti-CBP, and anti-p45/NF-E2 antibodies were also used to immunostain the (+) Ratjadone A/(+) DMSO cells (bottom three rows). The fractions (%) of cells with the majority (more than 90%) of the signals in their nuclei are indicated. (B) The subcellular locations of EKLF in MEL cells subjected to 3 days of DMSO induction with or without pretreatment with Ratjadone A were analyzed by Western blotting. Nu, nucleus; Cyto, cytosol. (C) Northern blotting of RNAs isolated from uninduced MEL cells (lane 1), MEL cells induced subjected to 3 days of DMSO induction (lane 2) or HMBA induction (lane 3), MEL cells treated with Ratjadone A for 2 h (lane 4), and MEL cells pretreated with Ratjadone A for 2 h and then induced with DMSO for 3 days (lane 5). Note the significantly lowered RNA levels of βmaj globin and ALAS-E in DMSO-induced cells pretreated with Ratjadone A in comparison to those of DMSO-MEL cells without the Ratjadone A treatment (compare lane 5 to lane 2).
FIG. 6.
FIG. 6.
Repression of βmaj globin gene transcription by Ratjadone A-mediated blockage of the nuclear import of EKLF. (A) The subcellular locations of EKLF in MEL cells subjected to 3 days of DMSO induction with (bottom four rows) or without (first row) pretreatment with Ratjadone A were analyzed by immunostaining. Note that the Ratjadone A treatment prevented the EKLF from entering into the nucleus during DMSO induction (second row). As controls, anti-GATA-1, anti-CBP, and anti-p45/NF-E2 antibodies were also used to immunostain the (+) Ratjadone A/(+) DMSO cells (bottom three rows). The fractions (%) of cells with the majority (more than 90%) of the signals in their nuclei are indicated. (B) The subcellular locations of EKLF in MEL cells subjected to 3 days of DMSO induction with or without pretreatment with Ratjadone A were analyzed by Western blotting. Nu, nucleus; Cyto, cytosol. (C) Northern blotting of RNAs isolated from uninduced MEL cells (lane 1), MEL cells induced subjected to 3 days of DMSO induction (lane 2) or HMBA induction (lane 3), MEL cells treated with Ratjadone A for 2 h (lane 4), and MEL cells pretreated with Ratjadone A for 2 h and then induced with DMSO for 3 days (lane 5). Note the significantly lowered RNA levels of βmaj globin and ALAS-E in DMSO-induced cells pretreated with Ratjadone A in comparison to those of DMSO-MEL cells without the Ratjadone A treatment (compare lane 5 to lane 2).
FIG. 7.
FIG. 7.
Mapping of EKLF domains required for DMSO-induced nuclear import of EKLF in MEL cells. (A) The subcellular locations of transiently expressed Flag-EKLF and Flag-3F in K562 cells. Top, schematic representation of the domain organization of EKLF. The proline-rich (pro-rich) region and the three-zinc-finger region (aa 292 to 376) are indicated. Shown below the EKLF map are the inserts of plasmid constructs pFlag-EKLF, pFlag-EKLF (1-296), and pFlag-3F used to transfect K562 and MEL cells. The subcellular locations of Flag-EKLF and Flag-3F in the transfected K562 cells were detected by immunostaining with anti-Flag. In either case, nearly all of the proteins were located in the nucleus. (B) The subcellular locations of transiently expressed Flag, Flag-EKLF, Flag-EKLF (1-296), and Flag-3F in MEL cells. Again, the locations of the exogenous proteins in the transfected MEL cells, before and after DMSO induction, were identified by immunostaining using anti-Flag as the probe. The nuclei were identified by DAPI staining. MetaMorph software (Meta Imaging Series version 6.1; Universal Imaging Corporation) was used to quantify the relative amounts of transiently expressed, Flag-tagged proteins in the nucleus and cytosol. For each experimental set, the percentage value (%) indicates the average fraction per cell of the corresponding exogenous protein located in the nucleus. The comparisons of the amounts of transiently expressed proteins in MEL cells before (white bars) and after (black bars) DMSO induction are shown schematically in the histogram for Flag, Flag-EKLF, Flag-EKLF (1-296), and Flag-3F. Note that transfected HA-EKLF behaved similarly to Flag-EKLF in MEL cells during DMSO induction (Shyu and Shen, unpublished results).
FIG. 7.
FIG. 7.
Mapping of EKLF domains required for DMSO-induced nuclear import of EKLF in MEL cells. (A) The subcellular locations of transiently expressed Flag-EKLF and Flag-3F in K562 cells. Top, schematic representation of the domain organization of EKLF. The proline-rich (pro-rich) region and the three-zinc-finger region (aa 292 to 376) are indicated. Shown below the EKLF map are the inserts of plasmid constructs pFlag-EKLF, pFlag-EKLF (1-296), and pFlag-3F used to transfect K562 and MEL cells. The subcellular locations of Flag-EKLF and Flag-3F in the transfected K562 cells were detected by immunostaining with anti-Flag. In either case, nearly all of the proteins were located in the nucleus. (B) The subcellular locations of transiently expressed Flag, Flag-EKLF, Flag-EKLF (1-296), and Flag-3F in MEL cells. Again, the locations of the exogenous proteins in the transfected MEL cells, before and after DMSO induction, were identified by immunostaining using anti-Flag as the probe. The nuclei were identified by DAPI staining. MetaMorph software (Meta Imaging Series version 6.1; Universal Imaging Corporation) was used to quantify the relative amounts of transiently expressed, Flag-tagged proteins in the nucleus and cytosol. For each experimental set, the percentage value (%) indicates the average fraction per cell of the corresponding exogenous protein located in the nucleus. The comparisons of the amounts of transiently expressed proteins in MEL cells before (white bars) and after (black bars) DMSO induction are shown schematically in the histogram for Flag, Flag-EKLF, Flag-EKLF (1-296), and Flag-3F. Note that transfected HA-EKLF behaved similarly to Flag-EKLF in MEL cells during DMSO induction (Shyu and Shen, unpublished results).

Similar articles

Cited by

References

    1. Anguita, E., J. Hughes, C. Heyworth, G. A. Blobel, W. G. Wood, and D. R. Higgs. 2004. Globin gene activation during haemopoiesis is driven by protein complexes nucleated by GATA-1 and GATA-2. EMBO J. 23:2841-2852. - PMC - PubMed
    1. Baron, M. H. 2003. Embryonic origins of mammalian hematopoiesis. Exp. Hematol. 31:1160-1169. - PubMed
    1. Bieker, J. J. 2005. Probing the onset and regulation of erythroid cell-specific gene expression. Mt. Sinai J. Med. 72:333-338. - PubMed
    1. Brown, J. M., J. Leach, J. E. Reittie, A. Atzberger, J. Lee-Prudhoe, W. G. Wood, D. R. Higgs, F. J. Iborra, and V. J. Buckle. 2006. Coregulated human globin genes are frequently in spatial proximity when active. J. Cell Biol. 172:177-187. - PMC - PubMed
    1. Bulger, M., and M. Groudine. 1999. Looping versus linking: toward a model for long-distance gene activation. Genes Dev. 13:2465-2477. - PubMed

Publication types