. 2007 Mar;27(6):2372-83.
doi: 10.1128/MCB.01340-06. Epub 2007 Jan 22.

Interleukin-6 impairs the insulin signaling pathway, promoting production of nitric oxide in human umbilical vein endothelial cells

Affiliations

Interleukin-6 impairs the insulin signaling pathway, promoting production of nitric oxide in human umbilical vein endothelial cells

Francesco Andreozzi et al. Mol Cell Biol. 2007 Mar.

Abstract

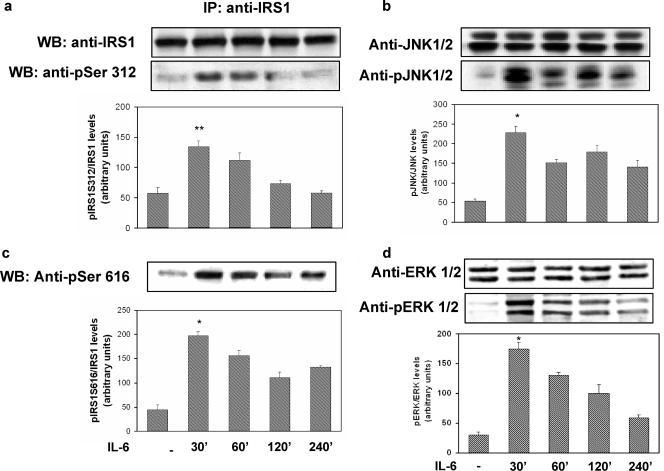
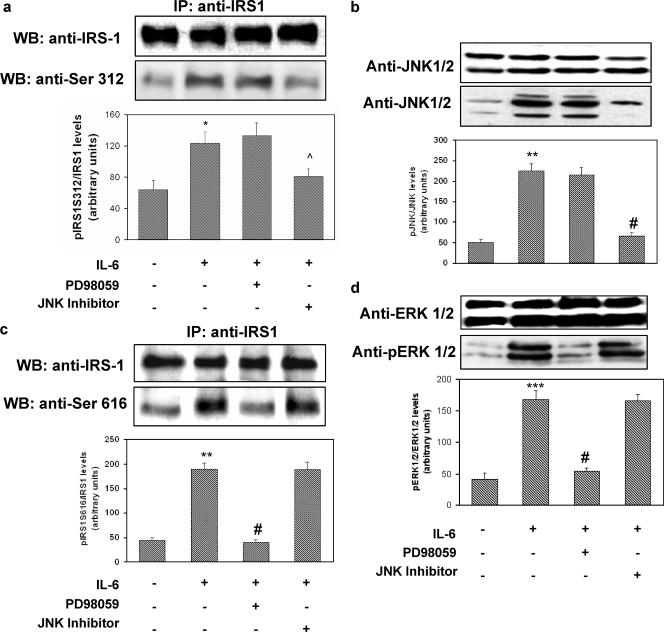
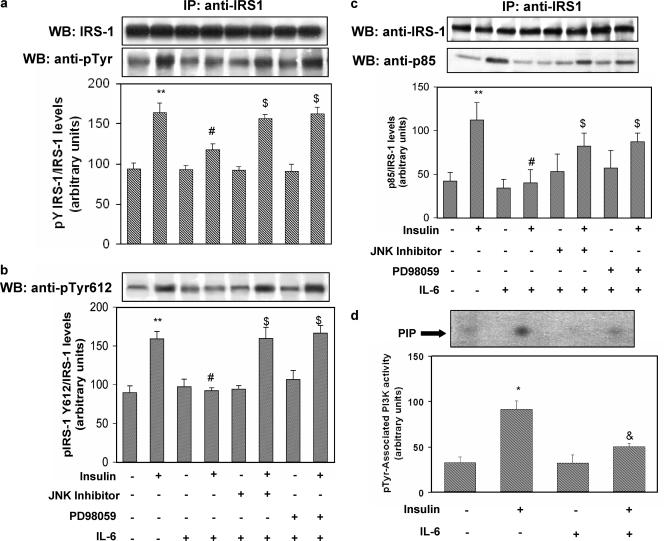
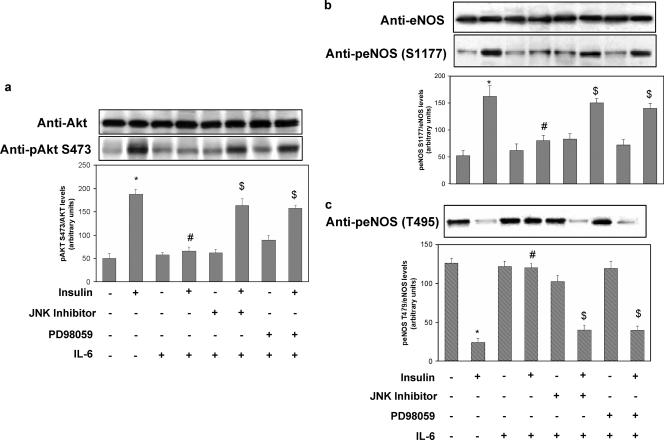
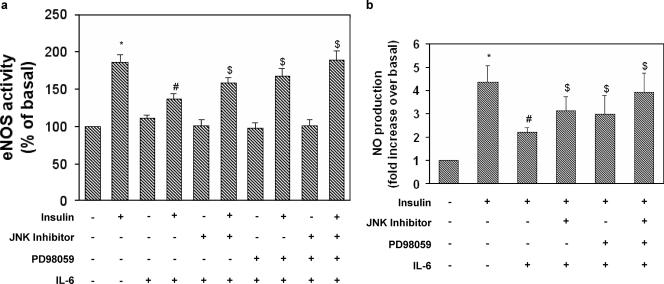
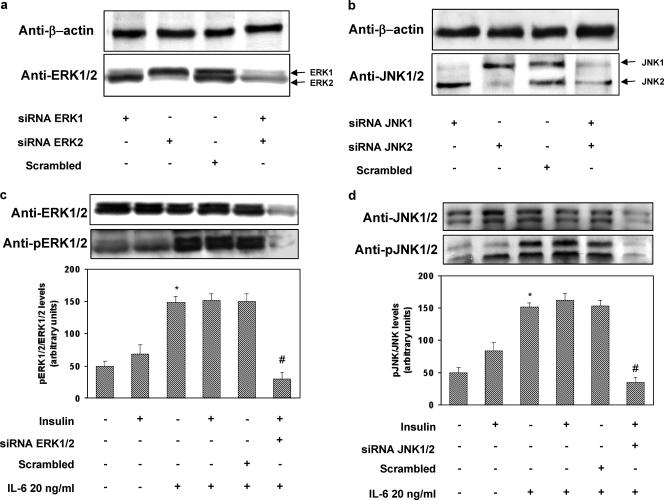
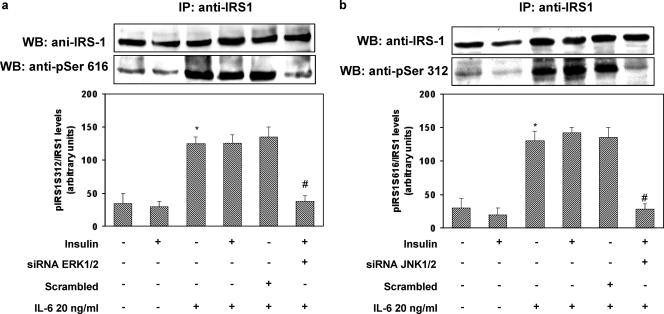
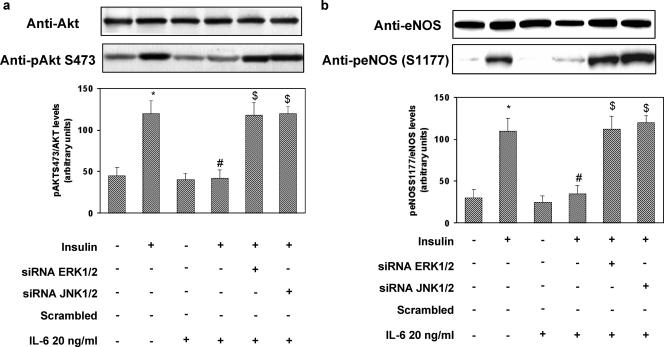
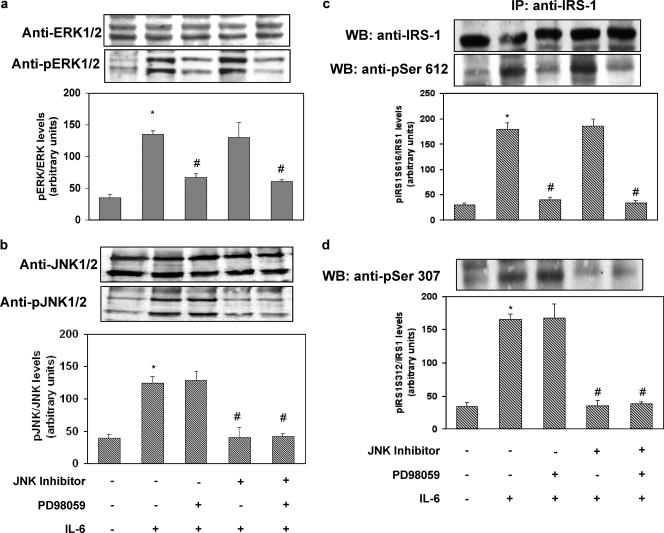
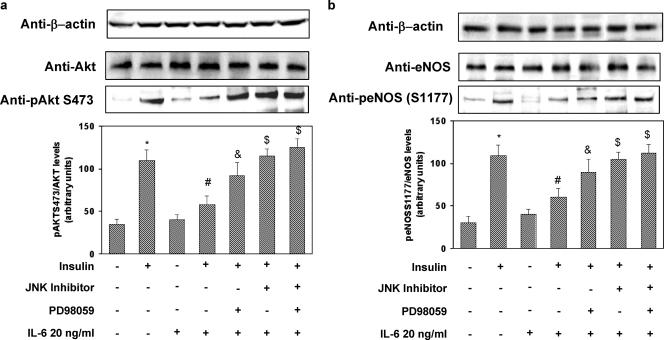
Interleukin 6 (IL-6) is an independent predictor of type 2 diabetes and cardiovascular disease and is correlated with insulin resistance. Insulin stimulates nitric oxide (NO) production through the IRS-1/PI3-kinase/Akt/eNOS pathway (where IRS-1 is insulin receptor substrate 1, PI3-kinase is phosphatidylinositol 3-kinase, and eNOS is endothelial NO synthase). We asked if IL-6 affects insulin vasodilator action both in human umbilical vein endothelial cells (HUVEC) and in the aortas of C57BL/6J mice and whether this inhibitory effect was caused by increased Ser phosphorylation of IRS-1. We observed that IL-6 increased IRS-1 phosphorylation at Ser(312) and Ser(616); these effects were paralleled by increased Jun N-terminal protein kinase (JNK) and extracellular signal-regulated kinase 1/2 (ERK1/2) phosphorylation and reversed by JNK and ERK1/2 inhibition. In addition, IL-6 treatment resulted in impaired IRS-1 phosphorylation at Tyr(612), a site essential for engaging PI3-kinase. Furthermore, IL-6 treatment reduced insulin-stimulated phosphorylation of eNOS at the stimulatory Ser(1177) site and impaired insulin-stimulated eNOS dephosphorylation at the inhibitory Thr(495) site. Insulin-stimulated eNOS activation and NO production were also inhibited by IL-6; these effects were reversed by inhibition of JNK and ERK1/2. Treatment of C57BL/6J mice with IL-6 resulted in impaired insulin-dependent activation of the Akt/eNOS pathway in the aorta as a result of JNK and ERK1/2 activation. Our data suggest that IL-6 impairs the vasodilator effects of insulin that are mediated by the IRS-1/PI3-kinase/Akt/eNOS pathway through activation of JNK and ERK1/2.


Figures

FIG. 1.
FIG. 1.
Time course of the effects of IL-6 on IRS-1, JNK, and ERK1/2 phosphorylation in HUVECs. The HUVECs were incubated with 20 ng/ml of IL-6 for the times indicated at the bottom, and cell lysates were subjected to Western blot analysis as indicated in Materials and Methods. (a) Ser312 phosphorylation of IRS-1 (lower blot) and total levels of IRS-1 (upper blot). (b) JNK phosphorylation (lower blot) and total levels of JNK (upper blot). IP, immunoprecipitation. (c) Ser616 phosphorylation of IRS-1. (d) ERK1/2 phosphorylation (lower blot) and total levels of ERK1/2 (upper blot). Each bar represents the mean ± SD of three independent experiments; the blots shown are from representative experiments. WB, Western blot. **: P < 0.01. *: levels in IL-6-treated cells versus levels in non-IL-6-treated cells; P < 0.02.
FIG. 2.
FIG. 2.
Reversibility of the effects of IL-6 on IRS-1, JNK, and ERK1/2 phosphorylation in HUVECs. HUVECs were incubated for 30 min in the presence or absence of 20 ng/ml of IL-6. In the experiments using cell-permeating JNK inhibitor I (20 mol/liter) or PD98059 (50 nmol/liter), these were added to the cells 30 min before the addition of IL-6. Cell lysates were subjected to Western blot analysis as indicated in Materials and Methods. (a) Ser312 phosphorylation of IRS-1 (lower blot) and total levels of IRS-1 (upper blot). (b) JNK phosphorylation (lower blot) and total levels of JNK (upper blot). (c) Ser616 phosphorylation of IRS-1. (d) ERK1/2 phosphorylation (lower blot) and total levels of ERK1/2 (upper blot). Each bar represents the mean ± SD of 4 independent experiments; the blots shown are from representative experiments. IP, immunoprecipitation; WB, Western blot. *: P < 0.05. **: P < 0.02. ***: levels in insulin-stimulated cells versus basal levels; P < 0.01. ^: P < 0.05. #: levels in insulin-stimulated, IL-6-treated cells versus levels in non-IL-6-treated, insulin-stimulated cells; P < 0.01. +: present. −: absent.
FIG. 3.
FIG. 3.
Effect of IL-6 on insulin-stimulated IRS-1 tyrosine phosphorylation and association with the p85 subunit of PI3-kinase and PI3-kinase activation in HUVECs. HUVECs were treated with IL-6 in the presence or absence of JNK inhibitor I or PD98059 as indicated in Fig. 2. Where specified, 100 nmol/liter insulin was then added for 10 min. Equal amounts of cell lysates were subjected to either immunoprecipitation (IP) with the indicated antibody or to direct immunoblotting. To normalize the blots for protein levels, blots were stripped and reprobed with primary antibodies against the total unphosphorylated form of the indicated protein. PI3-kinase activity was assayed in the immunoprecipitates as described in Materials and Methods. (a) Tyrosine phosphorylation of IRS-1 (lower blot) and total levels of IRS-1 (upper blot). (b) Tyr612 IRS-1 phosphorylation. (c) Association of IRS-1 with the p85 subunit (lower blot) and total levels of IRS-1 (upper blot). (d) PI3-kinase activity associated with phosphotyrosine immunoprecipitates. Each bar represents the mean ± SD of at least 3 independent experiments; the blots shown are from representative experiments. WB: Western blot. **: P < 0.02. *: levels in insulin-stimulated cells versus basal levels; P < 0.01. #: P < 0.01. &: levels in insulin-stimulated, IL-6-treated cells versus levels in non-IL-6-treated, insulin-stimulated cells; P < 0.02. $: levels in IL-6-treated cells that were insulin stimulated in the presence of PD98059 or JNK inhibitor versus levels in IL-6-treated, insulin-stimulated cells; P < 0.01. +: present. −: absent.
FIG. 4.
FIG. 4.
Effects of IL-6 on insulin-stimulated Akt and eNOS phosphorylation in HUVECs. HUVECs were cultured for 18 h in serum-deprived medium and incubated for 30 min in the presence or absence of 20 ng/ml IL-6. In experiments with cell-permeating JNK inhibitor I (20 mol/liter), or PD98059 (50 nmol/liter), these were added to cells 30 min before IL-6 addition. When specified, insulin was then added for 10 min at 100 nmol/liter. Equal amounts of cell lysates were subjected to Western blotting with the appropriate specific phosphoantibody as described in Materials and Methods. To normalize the blots for protein levels, the blots were stripped and reprobed with primary antibodies against the total unphosphorylated form of the indicated protein. (a) Ser473 Akt phosphorylation (lower blot) and total levels of Akt (upper blot). (b) Ser1177 eNOS phosphorylation (lower blot) and total levels of eNOS (upper blot). (c) Thr495 eNOS phosphorylation. Each bar represents the mean ± SD of three independent experiments; the blots shown are from representative experiments. *: levels in insulin-stimulated cells versus basal levels; P < 0.01. #: levels in insulin-stimulated, IL-6-treated cells versus levels in non-IL-6-treated, insulin-stimulated cells; P < 0.01. $: levels in IL-6-treated, insulin-stimulated cells incubated in the presence of PD98059 or JNK inhibitor versus levels in IL-6-treated, insulin-stimulated cells; P < 0.01. +: present. −: absent.
FIG. 5.
FIG. 5.
Reversibility of the effects of IL-6 on insulin-stimulated NOS activity in HUVECs. NOS activity was determined in cell lysates of HUVECs using a NOS detection system according to the manufacturer's instructions. Data were normalized by the amount of protein and reaction time. NO released in the medium by HUVECs was assessed by measuring the conversion of nitrate to nitrite and spectrophotometrically detecting total nitrite as a colored azo dye product of the Griess reaction according to the manufacturer's instructions. (a) Effects of JNK and MEK1 inhibitors on IL-6-induced inhibition of NOS activity. (b) Effects of JNK and MEK1 inhibitors on IL-6-induced inhibition of NO production. Each bar represents the mean ± SD of three independent experiments; the results of representative experiments are shown. *: levels in insulin-stimulated cells versus basal levels; P < 0.01. #: levels in insulin-stimulated IL-6-treated cells versus levels in non-IL-6-treated, insulin-stimulated cells; P < 0.01. $: levels in IL-6-treated, insulin-stimulated cells incubated in the presence of either PD98059 or JNK inhibitor or both versus levels in IL-6-treated, insulin-stimulated cells; P < 0.01. +: present. −: absent.
FIG. 6.
FIG. 6.
Effects of stealth siRNA on ERK1/2 and JNK levels and phosphorylation in HUVECs. The HUVECs were seeded in a 6-well plate such that they would be 50 to 60% confluent at the time of transfection. The day after, the cells were transfected according to the manufacturer's protocol in antibiotic-free and serum-free Dulbecco's modified Eagle medium with Lipofectamine 2000 (3.5 μl/ml) and each stealth siRNA (100 nM) or the pooled Erk1-Erk2 siRNAs (200 nM) and JNK1-JNK2 siRNAs (200 nM); a scrambled siRNA was used as a negative control. After 4 h, 1 volume of complete growth medium was added. Seventy-two hours posttransfection, the cells were serum starved for 4 h, stimulated with IL-6 and insulin, and analyzed as described in Materials and Methods. Each bar represents the mean ± SD of four independent experiments; the blots shown are from representative experiments. (a) Total levels of ERK1/2 (lower blot) and levels of beta-actin (upper blot). (b) Total levels of JNK (lower blot) and levels of beta-actin (upper blot). (c) ERK1/2 phosphorylation (lower blot) and total levels of ERK1/2 (upper blot). (d) JNK phosphorylation (lower blot) and total levels of JNK (upper blot). *: levels in IL-6-treated versus levels in non-IL-6-treated cells; P < 0.01. #: levels in insulin-stimulated, IL-6-treated, specific-siRNA-transfected cells versus levels in insulin-stimulated, IL-6-treated cells transfected with a scrambled siRNA; P < 0.01. +: present. −: absent.
FIG. 7.
FIG. 7.
Effects of stealth siRNA ERK1/2 or JNK1/2 on insulin-stimulated IRS-1 phosphorylation in HUVECs. HUVECs were transfected according to the manufacturer's protocol in antibiotic-free and serum-free Dulbecco's modified Eagle medium with Lipofectamine 2000 (3.5 μl/ml) and each stealth siRNA (100 nM) or the pooled Erk1-Erk2 siRNAs (200 nM) and JNK1-JNK2 siRNAs (200 nM); a scrambled siRNA was used as a negative control. The cells were then incubated for 30 min in the presence or absence of 20 ng/ml of IL-6. Cell lysates were subjected to Western blot analysis as indicated in Materials and Methods. Each bar represents the mean ± SD of four independent experiments; the blots shown are from representative experiments. (a) Ser616 phosphorylation of IRS-1 (lower blot) and total levels of IRS-1 (upper blot); (b) Ser312 phosphorylation of IRS-1 (lower blot) and total levels of IRS-1 (upper blot). IP, immunoprecipitation; WB, Western blot. *: levels in IL-6-treated versus levels in non-IL-6-treated cells; P < 0.01. #: levels in insulin-stimulated, IL-6-treated, specific-siRNA-transfected cells versus levels in insulin-stimulated, IL-6-treated cells transfected with a scrambled siRNA; P < 0.01. +: present. −: absent.
FIG. 8.
FIG. 8.
Effects of stealth siRNA ERK1/2 or JNK1/2 on insulin-stimulated Akt and eNOS phosphorylation in HUVECs. HUVECs were transfected according to the manufacturer's protocol in antibiotic-free and serum-free Dulbecco's modified Eagle medium with Lipofectamine 2000 (3.5 μl/ml) and pooled Erk1-Erk2 siRNAs (200 nM) or JNK1-JNK2 siRNAs (200 nM); a scrambled siRNA was used as a negative control. The cells were then incubated for the indicated period of time in the presence or absence of 20 ng/ml of IL-6. Cell lysates were subjected to Western blot analysis as indicated in Materials and Methods. (a) Ser473 Akt phosphorylation (lower blot) and total levels of Akt (upper blot). (b) Ser1177 eNOS phosphorylation (lower blot) and total levels of eNOS (upper blot). Each bar represents the mean ± SD of three independent experiments; the blots shown are from representative experiments. *: P < 0.01, levels in insulin-stimulated cells versus basal levels. #: levels in insulin-stimulated, IL-6-treated cells versus levels in non-IL-6-treated, insulin-stimulated cells; P < 0.01. $: levels in IL-6-treated, insulin-stimulated cells transfected with either ERK1/2 siRNA or JNK3/4 versus levels in IL-6-treated, insulin-stimulated cells transfected with a scrambled siRNA; P < 0.01. +: present. −: absent.
FIG. 9.
FIG. 9.
Reversibility of the effect of IL-6 on IRS-1, JNK, and ERK1/2 phosphorylation in C57BL/6J mouse aortas. Three-month-old C57BL/6J female mice were injected i.p. with rhIL-6 1 h before insulin stimulation. In experiments using JNK inhibitor I or PD98059, these were injected i.p. at 10 mg/kg of body weight 2 h before IL-6 injection. Animals were then stimulated with insulin (i.p., 0.75 mU/g of body weight). The aortas were immediately collected and snap-frozen in liquid nitrogen. Equal amounts of aortic lysates were subjected to Western blotting with the appropriate specific phosphoantibodies as described in Materials and Methods. To normalize the blots for protein levels, blots were stripped and reprobed with primary antibodies against the total unphosphorylated form of the indicated protein. (a) ERK1/2 phosphorylation (lower blot) and total levels of ERK1/2 (upper blot). (b) JNK phosphorylation (lower blot) and total levels of JNK (upper blot). (c) Ser612 phosphorylation of IRS-1(lower blot) and total levels of IRS-1 (upper blot). IP: immunoprecipitation. (d) Ser307 phosphorylation of IRS-1(lower blot) and total levels of IRS-1 (upper blot). Each bar represents the mean ± SD of five independent experiments; the blots shown are from representative experiments. WB: Western blot. *: levels in aortas of IL-6-treated mice versus levels in aortas of control mice; P < 0.01. #: levels in aortas of IL-6-treated mice after injection of either JNK inhibitor I or PD98059 or both versus levels in aortas of IL-6-treated mice; P < 0.01. +: present. −: absent.
FIG. 10.
FIG. 10.
Effects of IL-6 on insulin-stimulated phosphorylation of eNOS and AKT in aortas of C57BL/6J mice. Three-month-old C57BL/6J female mice were injected IP with rhIL-6 for the indicated times. For experiments using JNK inhibitor I or PD98059, these were injected IP at 10 mg/kg of body weight 2 h before IL-6 injection. Animals were then stimulated with insulin (IP, 0.75 mU/g of body weight). The aortas were immediately collected and snap-frozen in liquid nitrogen. Equal amounts of aortic lysates were subjected to Western blotting with the appropriate specific phosphoantibodies as described in Materials and Methods. To normalize the blots for protein levels, blots were stripped and reprobed with primary antibodies against the total unphosphorylated form of the indicated protein. In addition to being normalized for gel loading, the same blots were reprobed with a beta-actin antibody. (a) Ser473 Akt phosphorylation (lower blot), total levels of Akt (middle blot), and levels of beta-actin levels (upper blot). (b) Ser1177 eNOS phosphorylation (lower blot), total levels of eNOS (middle blot), and levels of beta-actin (upper blot). Each bar represents the mean ± SD of five independent experiments; the blots shown are from representative experiments. *: levels in aortas of insulin-stimulated mice versus levels in aortas of control mice; P < 0.01. #: levels in aortas of insulin-stimulated, IL-6 treated mice versus levels in aortas of insulin-stimulated mice; P < 0.01. $: P < 0.01. *: levels in aortas of insulin-stimulated, IL-6-treated mice after injection of either JNK inhibitor I or PD98059 or both versus levels in aortas of insulin-stimulated, IL-6-treated mice; P < 0.02. +: present. −: absent.

References

    1. Aguirre, V., T. Uchida, L. Yenush, R. Davis, and M. F. White. 2000. The c-Jun NH(2)-terminal kinase promotes insulin resistance during association with insulin receptor substrate-1 and phosphorylation of Ser(307). J. Biol. Chem. 275:9047-9054. - PubMed
    1. Andreozzi, F., E. Laratta, A. Sciacqua, F. Perticone, and G. Sesti. 2004. Angiotensin II impairs the insulin signalling pathway promoting production of nitric oxide by inducing phosphorylation of IRS-1 on Ser312 and Ser616 in human umbilical vein endothelial cells. Circ. Res. 94:1211-1218. - PubMed
    1. Balletshofer, B. M., K. Rittig, M. D Enderle, et al. 2000. Endothelial dysfunction is detectable in young normotensive first-degree relatives of subjects with type 2 diabetes in association with insulin resistance. Circulation 101:1780-1784. - PubMed
    1. De Fea, K., and R. A. Roth. 1997. Modulation of insulin receptor substrate-1 tyrosine phosphorylation and function by mitogen-activated protein kinase. J. Biol. Chem. 272:31400-31406. - PubMed
    1. De Fea, K., and R. A. Roth. 1997. Protein kinase C modulation of insulin receptor substrate-1 tyrosine phosphorylation requires serine 612. Biochemistry 36:12939-12947. - PubMed

Publication types

MeSH terms