. 2007 Mar;27(6):2266-82.
doi: 10.1128/MCB.01439-06. Epub 2007 Jan 22.

Human glucocorticoid receptor beta binds RU-486 and is transcriptionally active

Affiliations

Human glucocorticoid receptor beta binds RU-486 and is transcriptionally active

Laura J Lewis-Tuffin et al. Mol Cell Biol. 2007 Mar.

Abstract

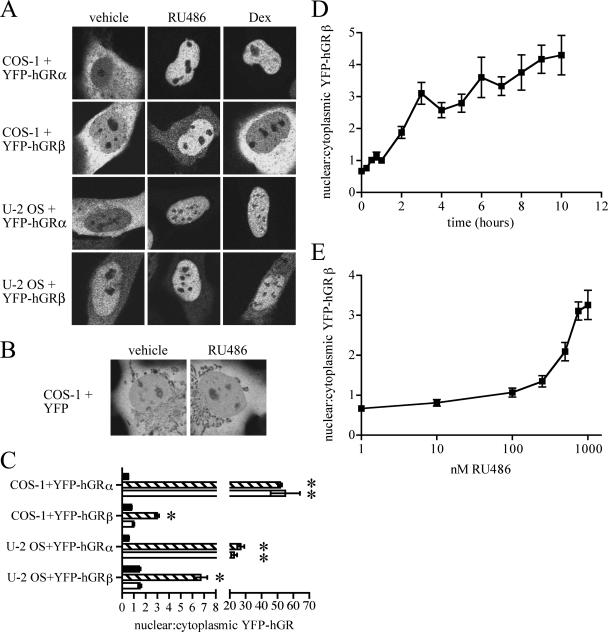
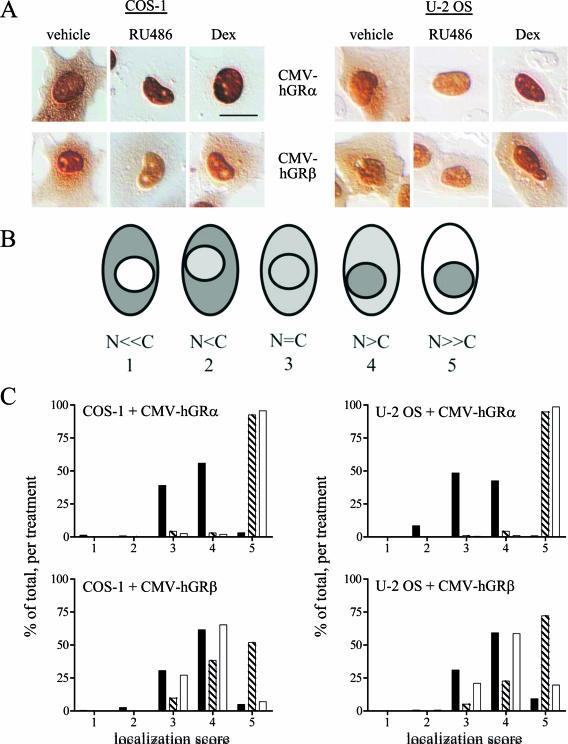
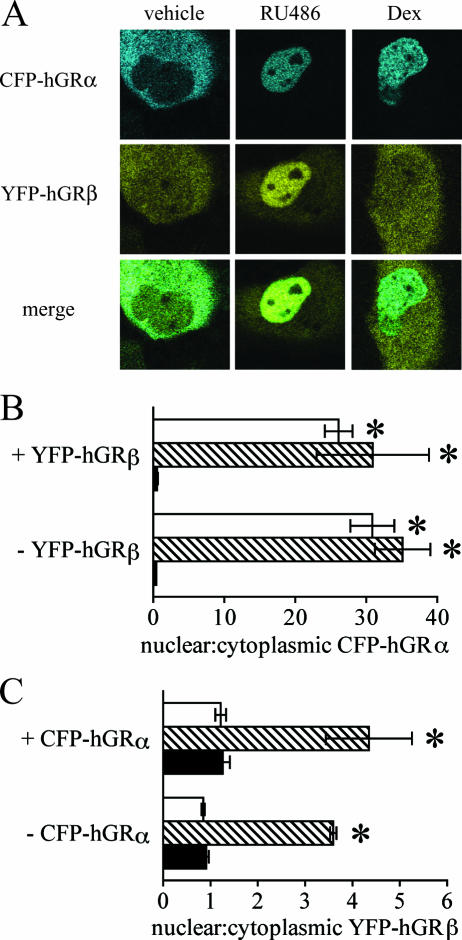
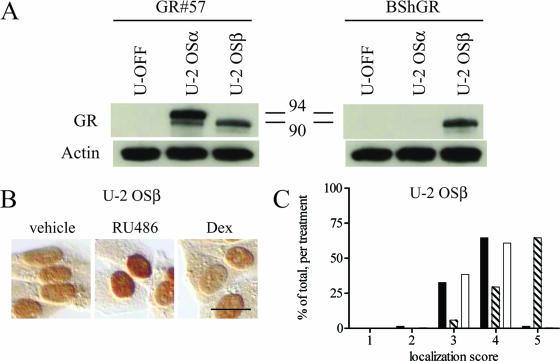
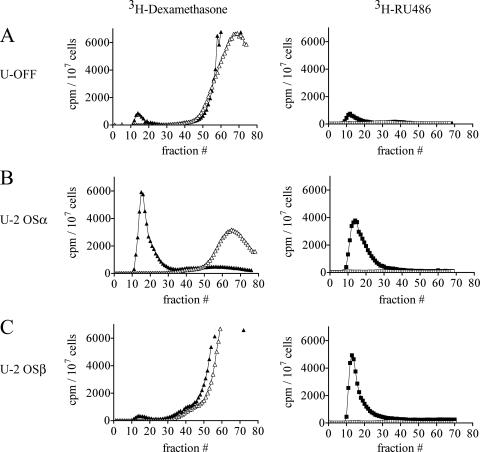
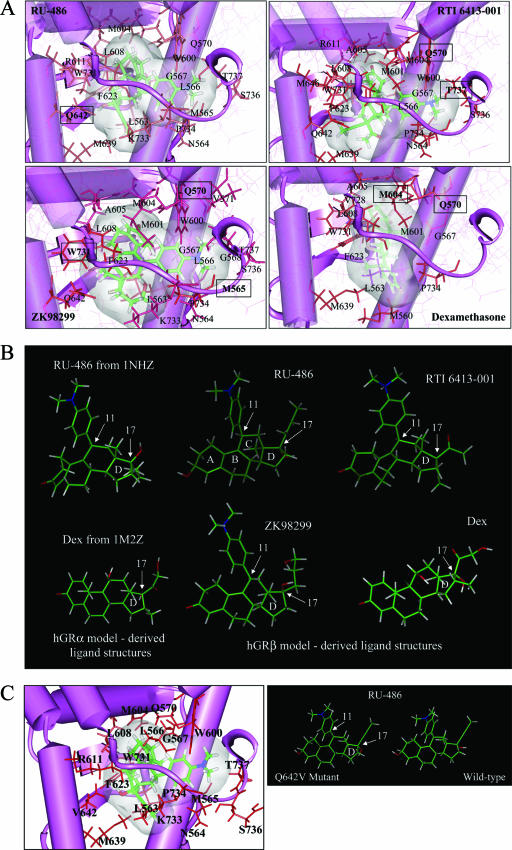
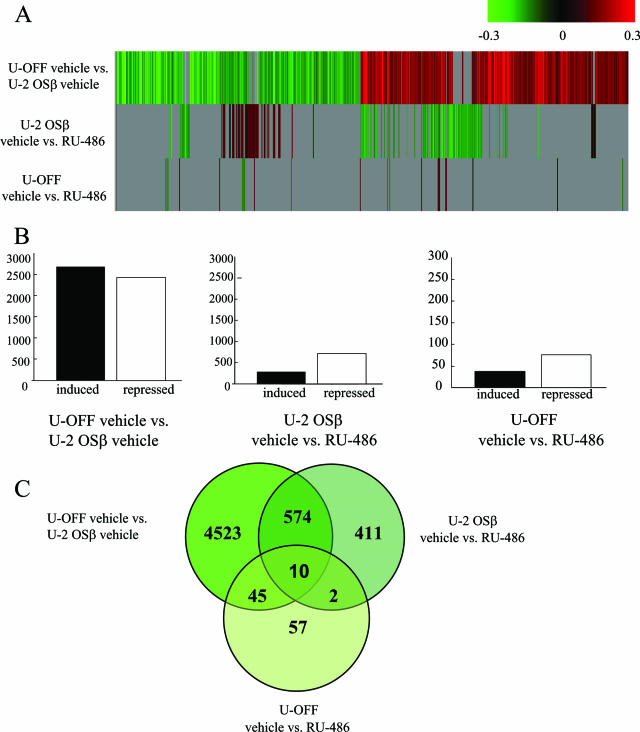
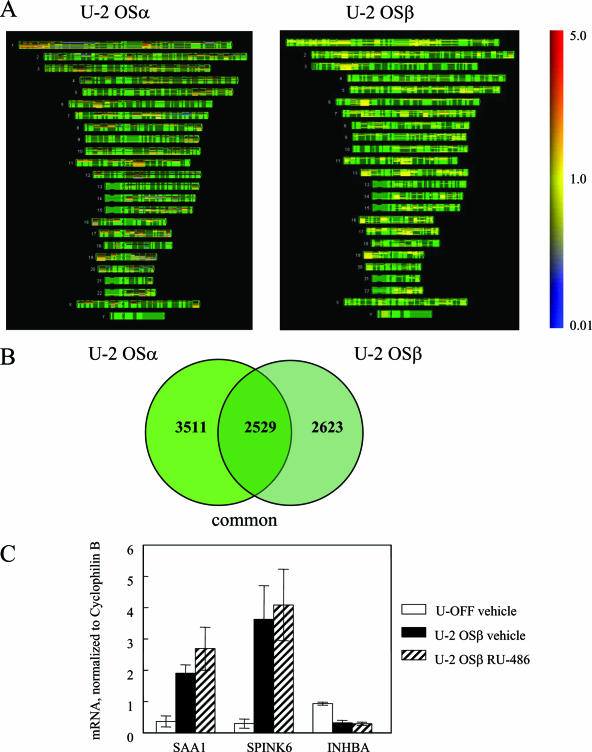
Human glucocorticoid receptor (hGR) is expressed as two alternately spliced C-terminal isoforms, alpha and beta. In contrast to the canonical hGRalpha, hGRbeta is a nucleus-localized orphan receptor thought not to bind ligand and not to affect gene transcription other than by acting as a dominant negative to hGRalpha. Here we used confocal microscopy to examine the cellular localization of transiently expressed fluorescent protein-tagged hGRbeta in COS-1 and U-2 OS cells. Surprisingly, yellow fluorescent protein (YFP)-hGRbeta was predominantly located in the cytoplasm and translocated to the nucleus following application of the glucocorticoid antagonist RU-486. This effect of RU-486 was confirmed with transiently expressed wild-type hGRbeta. Confocal microscopy of coexpressed YFP-hGRbeta and cyan fluorescent protein-hGRalpha in COS-1 cells indicated that the receptors move into the nucleus independently. Using a ligand binding assay, we confirmed that hGRbeta bound RU-486 but not the hGRalpha ligand dexamethasone. Examination of the cellular localization of YFP-hGRbeta in response to a series of 57 related compounds indicated that RU-486 is thus far the only identified ligand that interacts with hGRbeta. The selective interaction of RU-486 with hGRbeta was also supported by molecular modeling and computational docking studies. Interestingly, microarray analysis indicates that hGRbeta, expressed in the absence of hGRalpha, can regulate gene expression and furthermore that occupation of hGRbeta with the antagonist RU-486 diminishes that capacity despite the lack of helix 12 in the ligand binding domain.


Figures

FIG. 1.
FIG. 1.
YFP-hGRβ translocates into the nucleus of transfected cells in response to RU-486. (A) COS-1 and U-2 OS cells were transiently transfected with plasmids expressing YFP-hGRα or YFP-hGRβ and treated with ethanol vehicle or 1 μM RU-486 or dexamethasone (Dex) for 3 h before being examined with confocal microscopy. Both treatments caused nuclear translocation of YFP-hGRα in both cell lines; only RU-486 caused nuclear translocation of YFP-hGRβ. (B) COS-1 cells were transiently transfected with a plasmid expressing YFP and treated with 1 μM RU-486 for 3 h before imaging. RU-486 had no effect on the cellular localization of YFP. (C) The localization of YFP-hGRα and YFP-hGRβ in response to steroid treatment was quantified by determining the ratio of the fluorescence intensity in an area of the nucleus divided by the fluorescence intensity in a similarly sized area of the cytoplasm. Black bars indicate no treatment; striped bars indicate 1 μM RU-486; white bars indicate 1 μM dexamethasone. This analysis confirmed that RU-486 but not dexamethasone caused nuclear translocation of YFP-hGRβ in both cell lines. Data are means ± SEMs (n ≥ 30 cells per treatment condition); *, significantly different at P < 0.05 versus vehicle for that receptor-cell type combination. (D) COS-1 cells were transfected with a plasmid expressing YFP-hGRβ and treated for 0, 0.25, 0.5, 0.75, 1, 2, 3, 4, 5, 6, 7, 8, 9, or 10 h with 1 μM RU-486. Cells were then imaged and quantified as in panel C. Nuclear localization was clearly evident by 2 h of treatment. Data are means ± SEMs. (E) COS-1 cells were transfected with a YFP-hGRβ expression plasmid and treated for 3 h with 1, 10, 100, 250, 500, 750, or 1,000 nM of RU-486. Cells were then imaged and quantified as in panel C. Nuclear translocation of YFP-hGRβ first became evident with 250 nM RU-486. Data are means ± SEMs.
FIG. 2.
FIG. 2.
Wild-type hGRβ translocates into the nucleus in response to RU-486. (A) COS-1 (left) and U-2 OS (right) cells were transiently transfected with CMV-hGRα or CMV-hGRβ plasmids, which express wild-type hGRα or hGRβ, respectively, and treated with ethanol vehicle or 1 μM RU-486 or dexamethasone (Dex) for 3 h before being processed for immunocytochemistry with the GR#57 antibody, which recognizes both hGRα and hGRβ. (B) Schematic illustration of the scoring system used to quantitate the localization of the receptors with different treatments. A number value was assigned to each cell based on the relative amount of cytoplasmic and nuclear receptor as indicated (N, nuclear receptor; C, cytoplasmic receptor): N ≪ C, 1; N < C, 2; N = C, 3; N > C, 4; N ≫ C, 5. (C) Frequency histograms of the resulting localization scores are plotted (n ≥ 130). Black bars indicate receptor localization with vehicle treatment; striped bars indicate 1 μM RU-486; white bars indicate 1 μM dexamethasone. Both ligands caused statistically significant changes in the frequency histogram of hGRα, reflecting its nuclear translocation: the percentage of cells scored as 5 is higher for the RU-486 and dexamethasone treatments than for the vehicle treatment, while there are more vehicle-treated cells scoring at 4 or below. In contrast, only RU-486 caused nuclear translocation of hGRβ: there was little difference in the number of vehicle-treated cells versus dexamethasone-treated cells at any score, while the number of RU-486-treated cells with a score of 5 was greater than the number of vehicle-treated cells with that score. Bars, 25 μm.
FIG. 3.
FIG. 3.
RU-486-dependent nuclear translocation of hGRβ is not due to cytoplasmic heterodimerization with hGRα. (A) COS-1 cells were transiently transfected with equal amounts of plasmids expressing CFP-hGRα and YFP-hGRβ and treated with ethanol vehicle or 1 μM RU-486 or dexamethasone (Dex) for 3 h before being examined with confocal microscopy. Blue indicates localization of CFP-hGRα; yellow indicates YFP-hGRβ localization; in the merged image, green indicates areas where both receptors are located. Both RU-486 and dexamethasone caused nuclear translocation of CFP-hGRα; only RU-486 caused translocation of YFP-hGRβ. (B) Localization of CFP-hGRα was quantified by determining the ratio of the fluorescence intensity in an area of the nucleus divided by the fluorescence intensity in a similarly sized area of the cytoplasm in the absence or presence of cotransfected YFP-hGRβ, with or without steroid treatment. Black bars indicate vehicle treatment; striped bars indicate 1 μM RU-486; white bars are 1 μM dexamethasone. Both dexamethasone and RU-486 caused nuclear translocation of CFP-hGRα, regardless of the presence of YFP-hGRβ. Data are means ± SEMs (n ≥ 30 cells per treatment condition); *, significant difference at P < 0.05 versus vehicle treatment for that receptor-treatment combination. ANOVA indicated no statistically significant effect of YFP-hGRβ on the localization of CFP-hGRα. (C) Localization of YFP-hGRβ was quantified as in panel B in the absence or presence of cotransfected CFP-hGRα, with or without steroid treatment. Black bars indicate vehicle treatment; striped bars indicate 1 μM RU-486; white bars are 1 μM dexamethasone. RU-486 caused nuclear translocation of YFP-hGRβ to the same extent, and dexamethasone had no effect on translocation, regardless of the presence of CFP-hGRα. Data are means ± SEMs (n ≥ 30 cells per treatment condition); *, significant difference at P < 0.05 versus vehicle treatment for that receptor-treatment combination. ANOVA indicated no statistically significant effect of CFP-hGRα on the localization of YFP-hGRβ.
FIG. 4.
FIG. 4.
Expression and RU-486-dependent nuclear translocation of wild-type hGRβ in the U-2 OSβ stable cell line. (A) The U-2 OS cell line U-2 OSβ, stably expressing hGRβ under the control of a Tet-OFF promoter system, was created. U-2 OSα, U-2 OSβ, and the U-OFF parental cell line were treated for at least 3 h with 1 μM RU-486 and then harvested for Western blot assays. The GR#57 antibody recognizes both hGRα (94 kDa) and hGRβ (90 kDa); the BShGR antibody recognizes hGRβ only; the actin antibody was used to demonstrate equal loading of the lanes. The U-OFF cells did not express detectable levels of GR, while U-2 OSα and U-2 OSβ exclusively expressed hGRα or hGRβ, respectively. Numbers in the middle are molecular masses in kilodaltons. (B) U-2 OSβ cells were treated with ethanol vehicle or 1 μM RU-486 ordexamethasone (Dex) for 3 h before being processed for immunocytochemistry with the GR#57 antibody. Bar, 25 μm. RU-486 but not dexamethasone caused nuclear translocation of stably expressed hGRβ. (C) Quantification of the immunocytochemical localization of hGRβ receptor was carried out by assigning localization scores and plotting a frequency histogram as in Fig. 2B. This analysis confirmed that RU-486 but not dexamethasone caused the wild-type receptor to undergo nuclear translocation. Black bars indicate vehicle treatment; striped bars indicate 1 μM RU-486; white bars indicate 1 μM dexamethasone; n ≥ 290.
FIG. 5.
FIG. 5.
Wild-type hGRβ binds RU-486. (A) Whole-cell ligand binding assays were performed with U-OFF cells treated with 100 nM [3H]dexamethasone (closed triangles) or 100 nM [3H]RU-486 (closed squares) for 2 h in the presence or absence of excess cold steroid (50 μM dexamethasone [open triangles] or 100 μM RU-486 [open squares]). Cells were disrupted and applied to a Sephadex G-50 column, and fractions were collected to separate early-eluting bound steroid from late-eluting free steroid. The small elution between fractions 10 and 20 indicates ligand binding to the small amount of endogenous hGR or progesterone receptor (PR) present in these cells; this binding was effectively competed away with excess cold ligand, indicating that it was not nonspecific binding. (B) The experiment in panel A was repeated using U-2 OSα cells treated with 20 nM [3H]dexamethasone (closed triangles) or 100 nM [3H]RU-486 (closed squares) with and without 20 μM and 10 μM unlabeled steroid (open symbols), respectively. Both [3H]dexamethasone and [3H]RU-486 bound to hGRα in these cells; this binding was effectively competed away with excess cold ligand. (C) The experiment in panel A was repeated using U-2 OSβ cells treated with 100 nM [3H]dexamethasone (closed triangles) or 100 nM [3H]RU-486 (closed squares), with or without 50 μM or 100 μM unlabeled steroid (open symbols), respectively. As with the U-OFF cells, the small elution between fractions 10 and 20 with [3H]dexamethasone treatment indicates ligand binding to the small amount of endogenous hGR or PR present in these cells. In contrast, [3H]RU-486 showed sixfold-higher amounts of binding, which were effectively competed away with excess cold ligand in these cells, indicating binding of [3H]RU-486 to hGRβ.
FIG. 6.
FIG. 6.
Computer modeling of the hGRβ ligand binding domain docked with RU-486, RTI 6413-001, ZK98299, or dexamethasone. (A) Illustrations of the highest GlideScore poses for the ligands RU-486, RTI 6413-001, ZK98299, and dexamethasone computationally docked into the model of the hGRβ ligand binding domain. Amino acids labeled on the diagrams are predicated to be within 3 angstroms of the respective ligands; boxed amino acids are predicted to form hydrogen bonds with the respective ligands. The C-terminal tail of the hGRβ ligand binding domain can be seen to curl snugly around the dimethylaniline substituent of RU-486, RTI 6413-001, and ZK98299, while dexamethasone seems to make little contact with the hGRβ C-terminal tail. (B) Conformation of RU-486, RTI 6413-001, ZK98299, and dexamethasone (Dex) when computationally docked in the hGRβ ligand binding domain (middle and right-hand structures); the conformation of RU-486 and dexamethasone obtained from the solved crystal structures of the hGRα ligand binding domain (Protein Data Bank files 1NHZ and 1M2Z, respectively) is shown for comparison (left-hand structures). The positions of the D ring and carbons 11 and 17 are indicated. (C) (Left) Illustration of the ligand RU-486 computationally docked into the model of a Q642V hGRβ mutant ligand binding domain. Amino acids labeled on the diagrams are predicated to be within 3 angstroms of the ligand. No amino acids are predicted to form hydrogen bonds with RU-486 in the ligand binding domain of this mutant hGRβ. (Right) Conformation of RU-486 when computationally docked in the Q642V versus wild-type hGRβ ligand binding domains. Note that the orientation of the hydroxyl group on carbon 17 (indicated) differs between the two structures.
FIG. 7.
FIG. 7.
hGRβ can regulate gene expression. (A) Microarray analysis was performed on RNA from four biological replicates of U-OFF and U-2 OSβ cells treated for 6 h with either ethanol vehicle or 1 μM RU-486. Genes that were significantly different at P < 0.001 were identified for each comparison: U-OFF vehicle versus U-2 OSβ vehicle, U-2 OSβ vehicle versus RU-486, and U-OFF vehicle versus RU-486. These genes were combined into one list that was subjected to cluster analysis. Red indicates genes that were induced for each comparison; green indicates genes that were repressed. Fold changes are presented on a log-scale continuum with 0 (black) indicating no change for a given comparison. Any genes with P > 0.001 did not meet our stringency requirements for significance and are shown in gray. (B) Genes that were identified as being significantly regulated in panel A for each comparison were separated into induced versus repressed. Of the 5,152 genes that were statistically significantly regulated by hGRβ expression, 2,685 were induced and 2,467 were repressed (left graph). Of the 997 genes that met our criteria for being statistically significantly regulated by hGRβ plus RU-486 treatment, 260 were induced and 737 were repressed (middle graph). U-OFF cells treated with RU-486 yielded 114 significantly regulated genes with 44 genes induced and 77 repressed (right graph). (C) Genes from the combined gene lists are depicted using Venn diagrams. Genes that are common between each of the three comparison groups are represented in the overlapping circles.
FIG. 8.
FIG. 8.
Comparison of gene regulation between hGRα and hGRβ. (A) Microarray analysis was performed on RNA from three biological replicates of U-OFF and U-2 OSα cells. Genes that were significantly different at P < 0.001 were identified and combined into one list. This gene list was compared to the combined gene list of the hGRβ-expressing cells (U-OFF versus U-2 OSβ) using human chromosome mapping. These maps show the physical positions of the genes with known loci. The structure of each chromosome is depicted in green with induced genes in red and repressed genes in blue. The color bar on the right shows the expression level of these genes ranging from 5.0 (highly induced) to 0.01 (highly repressed). (B) The Venn diagram illustrates the genes that are commonly regulated by both hGRα and hGRβ. (C) Quantitative RT-PCR was performed using the 7900HT sequence detection system using predesigned primer/probe sets for SAA1, SPINK6, and INHBA and a custom primer/probe for cyclophilin B available from Applied Biosystems. Each primer/probe set was analyzed in triplicate and with at least three different sets of RNA isolated from U-OFF cells, U-2 OSβ vehicle-treated cells, and U-2 OSβ RU-486-treated cells and normalized to cyclophilin B.

Similar articles

Cited by

References

    1. Bamberger, C. M., A.-M. Bamberger, M. de Castro, and G. P. Chrousos. 1995. Glucocorticoid receptor β, a potential endogenous inhibitor of glucocorticoid action in humans. J. Clin. Investig. 95:2435-2441. - PMC - PubMed
    1. Bledsoe, R. K., V. G. Montana, T. B. Stanley, C. J. Delves, C. J. Apolito, D. D. McKee, T. G. Consler, D. J. Parks, E. L. Stewart, T. M. Willson, M. H. Lambert, J. T. Moore, K. H. Pearce, and H. E. Xu. 2002. Crystal structure of the glucocorticoid receptor ligand binding domain reveals a novel mode of receptor dimerization and coactivator recognition. Cell 110:93-105. - PubMed
    1. Christodoulopoulos, P., D. Y. M. Leung, M. W. Elliott, J. C. Hogg, S. Muro, M. Toda, S. Laberge, and Q. Hamid. 2000. Increased number of glucocorticoid receptor-β-expressing cells in the airways in fatal asthma. J. Allergy Clin. Immunol. 106:479-484. - PubMed
    1. Coward, P., D. Lee, M. V. Hull, and J. M. Lehmann. 2001. 4-Hydroxytamoxifen binds to and deactivates the estrogen-related receptor gamma. Proc. Natl. Acad. Sci. USA 98:8880-8884. - PMC - PubMed
    1. Edgar, R., M. Domrachev, and A. E. Lash. 2002. Gene Expression Omnibus: NCBI gene expression and hybridization array data repository. Nucleic Acids Res. 30:207-210. - PMC - PubMed

MeSH terms