. 2007 Jan 30;104(5):1546-51.
doi: 10.1073/pnas.0610185103. Epub 2007 Jan 22.

Distortion product otoacoustic emissions measured as vibration on the eardrum of human subjects

Affiliations

Distortion product otoacoustic emissions measured as vibration on the eardrum of human subjects

E Dalhoff et al. Proc Natl Acad Sci U S A. .

Abstract

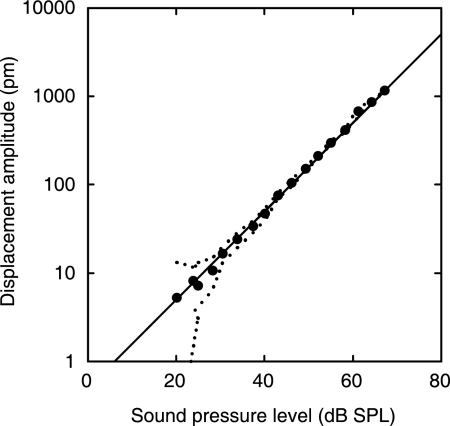
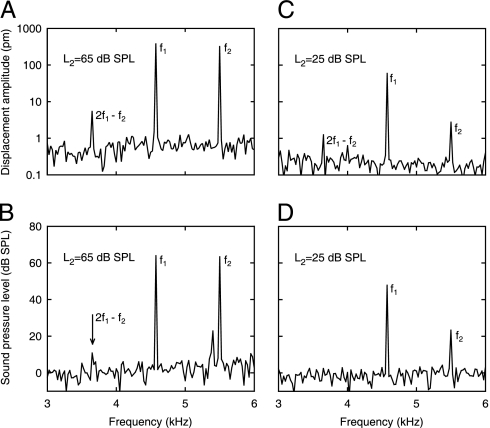
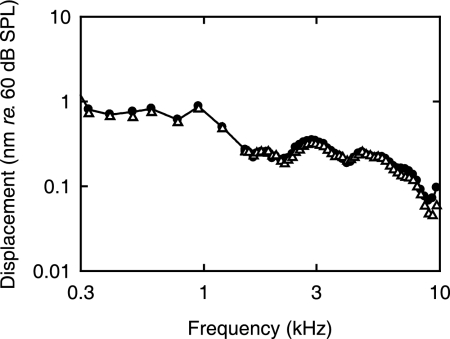
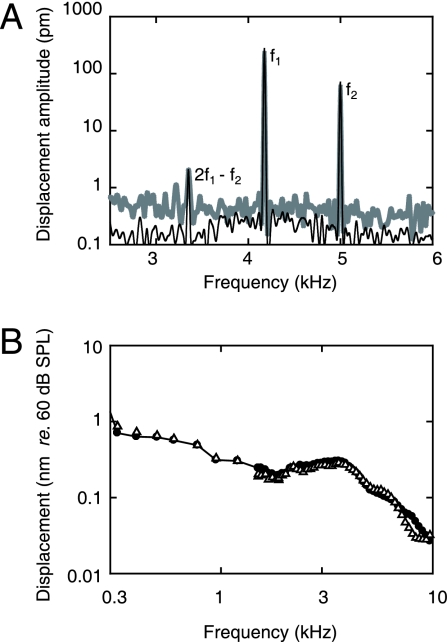
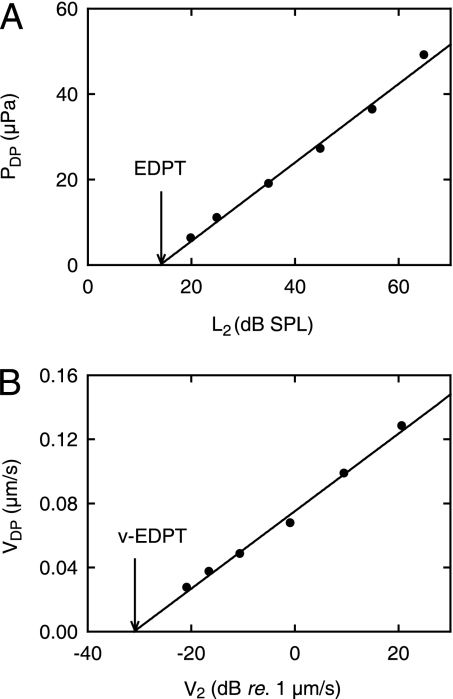
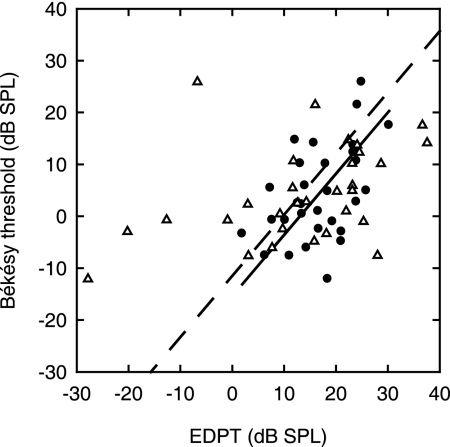
It has previously not been possible to measure eardrum vibration of human subjects in the region of auditory threshold. It is proposed that such measurements should provide information about the status of the mechanical amplifier in the cochlea. It is this amplifier that is responsible for our extraordinary hearing sensitivity. Here, we present results from a laser Doppler vibrometer that we designed to noninvasively probe cochlear mechanics near auditory threshold. This device enables picometer-sized vibration measurements of the human eardrum in vivo. With this sensitivity, we found the eardrum frequency response to be linear down to at least a 20-dB sound pressure level (SPL). Nonlinear cochlear amplification was evaluated with the cubic distortion product of the otoacoustic emissions (DPOAEs) in response to sound stimulation with two tones. DPOAEs originate from mechanical nonlinearity in the cochlea. For stimulus frequencies, f1 and f2, with f2/f1 = 1.2 and f2 = 4-9.5 kHz, and intensities L1 and L2, with L1 = 0.4L(2) + 39 dB and L2 = 20-65 dB SPL, the DPOAE displacement amplitudes were no more than 8 pm across subjects (n = 20), with hearing loss up to 16 dB. DPOAE vibration was nonlinearly dependent on vibration at f2. The dependence allowed the hearing threshold to be estimated objectively with high accuracy; the standard deviation of the threshold estimate was only 8.6 dB SPL. This device promises to be a powerful tool for differentially characterizing the mechanical condition of the cochlea and middle ear with high accuracy.


Conflict of interest statement

The authors declare no conflict of interest.

Figures

Fig. 1.
Fig. 1.
Dependence of umbo displacement amplitude on SPL for single-tone stimulation (3.5 kHz) measured for an open sound field. The linear regression line of unity slope (1 dB/dB) indicates that the measured umbo response is linear. The dotted lines delineate the maximum noise level in the 100-Hz sidebands adjacent to the stimulus frequency. A reflector was not placed on the umbo. (Subject identifier: JT.)
Fig. 2.
Fig. 2.
Amplitude spectra of umbo displacement (A and C) and sound pressure (B and D) for two-tone stimulation with f2 = 5.5 kHz and f1 = 4.6 kHz, measured simultaneously for an open sound field. (A and B) L2 = L1 = 65 dB SPL. The DP at 2f1f2 presents displacement amplitude of 5.6 pm on the umbo and SPL of 10.8 dB (arrow). (C and D) L2 = 25 dB SPL and L1 = 49 dB SPL. The umbo displacement amplitude is 1.25 pm at 2f1f2; the sound pressure is not detectable there. A reflector was placed on the umbo. (Subject identifier: AS.)
Fig. 3.
Fig. 3.
Displacement amplitude responses of the umbo expressed for a SPL of 60 dB. Responses were measured before (●) and 30 min after (▵) measuring the DPOAE responses. Notice that the reproducibility is better than 1 dB up to 7 kHz. DPOAE data from this subject are shown in Fig. 2.
Fig. 4.
Fig. 4.
Reproducibility of umbo vibration responses from one day to the next, with and without placement of a reflector. The measurements on the first day were made without placement of a reflector on the umbo, whereas a reflector was placed for the measurements 24 h later. (A) Amplitude spectra for two-tone stimulation with f2 = 5.0 kHz, f1 = 4.2 kHz, L2 = 55 dB SPL, and L1 = 61 dB SPL. The gray shaded line represents measurements without reflector placement on the first day. The black line represents measurements with reflector placement 24 h later. Notice that (i) all three signals superimpose and (ii) there is a (small) improvement of SNR with the reflector (up to 10 dB below 3.6 kHz). (B) Displacement amplitude responses of the umbo expressed for a SPL of 60 dB. The measurements shown are without reflector placement on the first day (●) and with reflector placement 24 h later (▵). Notice that the reproducibility is better than 1 dB up to 7 kHz. (Subject identifier: SK.)
Fig. 5.
Fig. 5.
Dependence of DPOAEs on primary stimulus level. (A) DPOAE sound pressure (PDP) as a function of SPL (L2) at the stimulus frequency, f2, of the second primary tone. Pressures were measured in a closed sound field. (B) DPOAE umbo velocity (VDP) as a function of umbo velocity (V2) at f2. Velocities were measured in an open sound field. The stimulus parameters were as follows: f2 = 5.5 kHz, f1 = 4.6 kHz, L2 = 25–65 dB SPL, and L1 = 0.4L2 + 39 dB. The lowest measured pressure amplitude at 2f1f2 = 3.7 kHz is 6 μPa, or −10.5 dB SPL. The lowest measured vibration amplitude at 2f1f2 = 3.7 kHz corresponds to a displacement amplitude of 1.18 pm. (A) The intersection of the regression line (r2 = 0.99, slope = 0.92 ± 0.04 μPa/dB SPL) with the abscissa (arrow) yields the so-called (19) EDPT = 14 dB SPL. (B) Correspondingly, the intersection of the regression line (r2 = 0.99, slope = 2.42 ± 0.10 nm/s/dB re. 1 μm/s) with the abscissa (arrow) yields the v-EDPT = 0.0272 μm/s. A reflector was placed on the umbo. (Subject identifier: AS.)
Fig. 6.
Fig. 6.
Békésy threshold as a function of the EDPT. The measurements shown are for EDPT derived from conventional pressure in a closed sound field (▵) and for EDPT derived from umbo vibration measurements in an open sound field. n = 30 I/O functions from 14 subjects; f2 = 4–9.5 kHz. Regression lines for both the sound (dashed line) and the vibration (solid line) data have fixed slopes at 1.18 dB/dB, equal to the value derived by Boege and Janssen (19) for pressure DPOAEs. Their data set contained 4,236 points and exhibited a standard deviation of the Békésy thresholds from the regression line of 10.9 dB SPL. Here, the standard deviation of the Békésy thresholds from the regression line is 16.7 dB SPL for the sound pressure and 8.6 dB SPL for the umbo vibration measurements.

References

    1. Ruggero MA, Narayan SS, Temchin AN, Recio A. Proc Natl Acad Sci USA. 2000;97:11744–11750. - PMC - PubMed
    1. Lu TK, Zhak S, Dallos P, Sarpeshkar R. Hear Res. 2006;214:45–67. - PubMed
    1. Robles L, Ruggero MA. Physiol Rev. 2001;81:1305–1352. - PMC - PubMed
    1. Scherer MP, Gummer AW. Proc Natl Acad Sci USA. 2004;101:17652–17657. - PMC - PubMed
    1. Zwislocki JJ. Auditory Sound Transmission: An Autobiographical Perspective. Mahwah, NJ: Lawrence Erlbaum; 2002.

Publication types

LinkOut - more resources