

doi: 10.1073/pnas.0508830104.
Epub 2007 Jan 22.
Estimation of the rate of killing by cytotoxic T lymphocytes in vivo
Affiliations
- PMID: 17242364
- PMCID: PMC1785271
- DOI: 10.1073/pnas.0508830104
Item in Clipboard
Estimation of the rate of killing by cytotoxic T lymphocytes in vivo
Proc Natl Acad Sci U S A.
.
Abstract
Cytotoxic T lymphocytes (CTL) help control virus infections by killing virus-infected (target) cells. How fast do CTL find and kill target cells in vivo? Experiments allow us to follow populations of labeled target cells after their transfer into immune mice where they are killed by CTL. Here, we develop models of the migration and killing processes involved in these experiments and use them to quantitatively analyze the in vivo killing data. These models allow us to estimate the rate constant for killing of target cells by CTL.
Conflict of interest statement
The authors declare no conflict of interest.
Figures
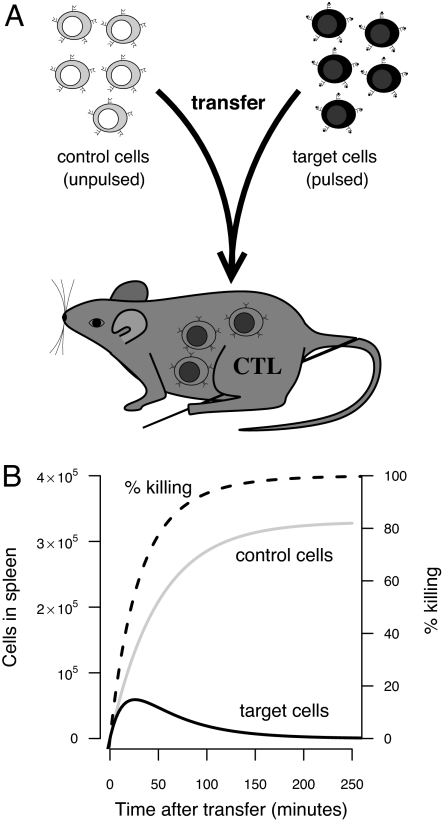
The experimental design of the in vivo CTL killing assays. (A) Control and peptide-pulsed target cells were injected into LCMV immune mice (containing CTL specific to the pulsed target cells). (B) The numbers of control and specific target cells in the spleen are illustrated by the gray and black lines, respectively. The gray line shows how the target cells migrate into the spleen, and the lesser number of specific target cells (black line) shows about how fast these cells are killed by specific CTL. The killing is usually described by the percentage of specific target cells killed [i.e., (1 − target/control) × 100] and is shown by the dashed line.
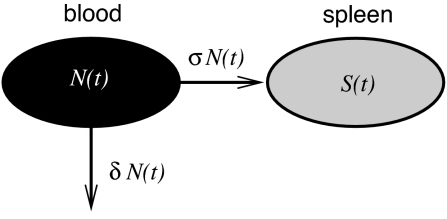
Schematic for the model describing the migration of target cells into the spleen.
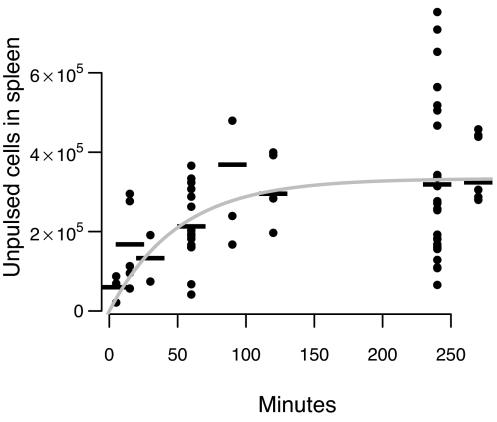
Migration of unpulsed cells into the spleen. The dots show the individual data points, the dashes are the mean number of cells in the spleen at a given time, and the line shows the best fit of the model described by Eq. 1 to the data.
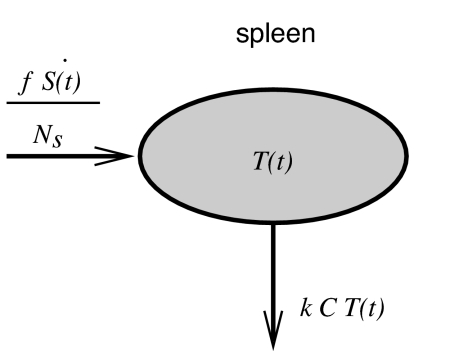
Schematic for the model describing the dynamics of target cells in the spleen. The target cells migrate into the spleen and are killed by CTL.
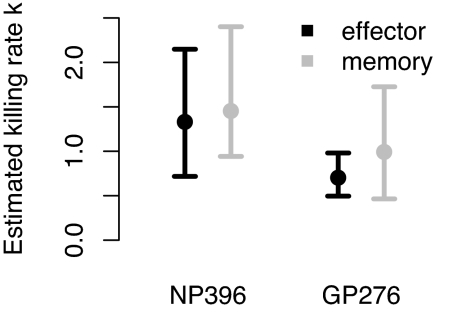
A plot of the estimates for the rate constants for CTL killing, k (min−1) and their 95% CI.
Similar articles
-
Investigating CTL mediated killing with a 3D cellular automaton.PLoS Comput Biol. 2009 Aug;5(8):e1000466. doi: 10.1371/journal.pcbi.1000466. Epub 2009 Aug 21. PLoS Comput Biol. 2009. PMID: 19696876 Free PMC article.
-
Spatial heterogeneity and peptide availability determine CTL killing efficiency in vivo.PLoS Comput Biol. 2014 Sep 18;10(9):e1003805. doi: 10.1371/journal.pcbi.1003805. eCollection 2014 Sep. PLoS Comput Biol. 2014. PMID: 25233372 Free PMC article.
-
Notwithstanding Circumstantial Alibis, Cytotoxic T Cells Can Be Major Killers of HIV-1-Infected Cells.J Virol. 2016 Jul 27;90(16):7066-7083. doi: 10.1128/JVI.00306-16. Print 2016 Aug 15. J Virol. 2016. PMID: 27226367 Free PMC article.
-
Mechanisms and Dynamics of T Cell-Mediated Cytotoxicity In Vivo.Trends Immunol. 2017 Jun;38(6):432-443. doi: 10.1016/j.it.2017.04.002. Epub 2017 May 9. Trends Immunol. 2017. PMID: 28499492 Review.
-
What do mathematical models tell us about killing rates during HIV-1 infection?Immunol Lett. 2015 Nov;168(1):1-6. doi: 10.1016/j.imlet.2015.07.009. Epub 2015 Aug 13. Immunol Lett. 2015. PMID: 26279491 Review.
Cited by
-
iSECRETE: Integrating Microfluidics and DNA Proximity Amplification for Synchronous Single-Cell Activation and IFN-γ Secretion Profiling.Adv Sci (Weinh). 2024 Oct;11(40):e2309920. doi: 10.1002/advs.202309920. Epub 2024 Aug 22. Adv Sci (Weinh). 2024. PMID: 39175207 Free PMC article.
-
Exploring the role of the immune response in preventing antibiotic resistance.J Theor Biol. 2009 Feb 21;256(4):655-62. doi: 10.1016/j.jtbi.2008.10.025. Epub 2008 Nov 8. J Theor Biol. 2009. PMID: 19056402 Free PMC article.
-
Modeling T cell responses to antigenic challenge.J Pharmacokinet Pharmacodyn. 2014 Oct;41(5):415-29. doi: 10.1007/s10928-014-9387-8. Epub 2014 Oct 1. J Pharmacokinet Pharmacodyn. 2014. PMID: 25269610 Free PMC article. Review.
-
Herpes simplex virus-2 dynamics as a probe to measure the extremely rapid and spatially localized tissue-resident T-cell response.Immunol Rev. 2018 Sep;285(1):113-133. doi: 10.1111/imr.12672. Immunol Rev. 2018. PMID: 30129205 Free PMC article. Review.
-
Cytotoxic T Lymphocytes Control Growth of B16 Tumor Cells in Collagen-Fibrin Gels by Cytolytic and Non-Lytic Mechanisms.Viruses. 2023 Jun 27;15(7):1454. doi: 10.3390/v15071454. Viruses. 2023. PMID: 37515143 Free PMC article.
References
-
- Perelson S. Nat Rev Immunol. 2002;2:28–36. - PubMed
-
- Antia R, Ganusov VV, Ahmed R. Nat Rev Immunol. 2005;5:101–111. - PubMed
-
- Buchmeier MJ, Zajac AJ. In: Persistent Viral Infections. Ahmed R, Chen I, editors. New York: Wiley; 1998. pp. 575–605.
-
- Pamer EG. Nat Rev Immunol. 2004;4:812–823. - PubMed
-
- Arstila TP, Casrouge A, Baron V, Even J, Kanellopoulos J, Kourilsky P. Science. 1999;286:958–961. - PubMed
Publication types
MeSH terms
Grants and funding
LinkOut - more resources
Full Text Sources
Other Literature Sources
Molecular Biology Databases
