

Mapping and identification of candidate loci responsible for Peromyscus hybrid overgrowth
- PMID: 17242862
- PMCID: PMC1794137
- DOI: 10.1007/s00335-006-0083-x
Mapping and identification of candidate loci responsible for Peromyscus hybrid overgrowth
Abstract
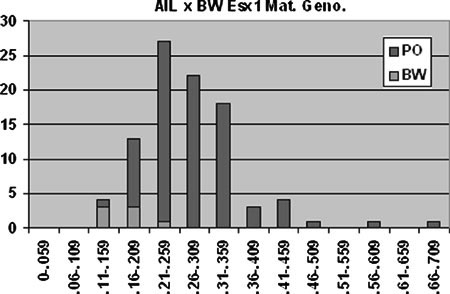
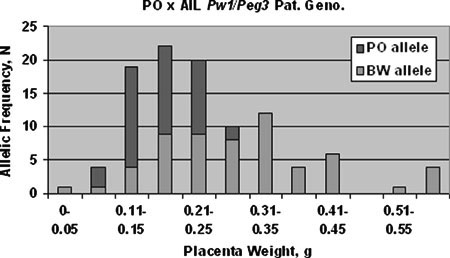
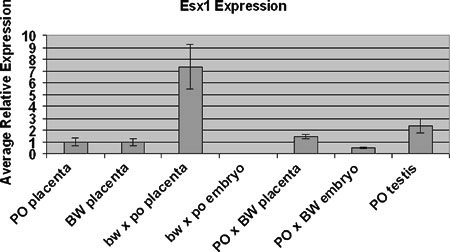
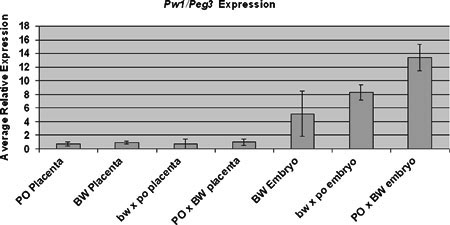
Crosses between two recently diverged rodent species of the genus Peromyscus result in dramatic parent-of-origin effects on growth and development. P. maniculatus females crossed with P. polionotus males yield growth-retarded conceptuses, whereas the reciprocal cross results in overgrowth and lethality. These hybrid effects are particularly pronounced in the placenta. We previously detected linkage to two regions of the genome involved in the overgrowth effects. One locus, termed Peal, is a paternally expressed autosomal locus mapping to a domain whose house mouse equivalent contains several clusters of imprinted genes. The other locus, termed Mexl, maps to a gene-poor region of the X chromosome. Here we use an advanced intercross line to verify and narrow the regions of linkage and identify candidate genes for Mexl and Peal. While we have previously shown that Mexl affects both pre-and postnatal growth, we show here that Peal affects only prenatal growth. Utilizing criteria such as mutant phenotypes and allelic expression, we identify the loci encoding the homeobox protein Esx1 and the zinc-finger protein Pw1/Peg3 as candidates. Both loci exhibit expression changes in the hybrids.
Figures
Similar articles
-
Genetic and epigenetic incompatibilities underlie hybrid dysgenesis in Peromyscus.Nat Genet. 2000 May;25(1):120-4. doi: 10.1038/75518. Nat Genet. 2000. PMID: 10802670
-
Genetic evidence for a maternal effect locus controlling genomic imprinting and growth.Genesis. 2005 Dec;43(4):155-65. doi: 10.1002/gene.20166. Genesis. 2005. PMID: 16283622
-
Divergent genetic and epigenetic post-zygotic isolation mechanisms in Mus and Peromyscus.J Evol Biol. 2004 Mar;17(2):453-60. doi: 10.1046/j.1420-9101.2003.00656.x. J Evol Biol. 2004. PMID: 15009278
-
Peromyscus (deer mice) as developmental models.Wiley Interdiscip Rev Dev Biol. 2014 May-Jun;3(3):211-30. doi: 10.1002/wdev.132. Epub 2013 Dec 3. Wiley Interdiscip Rev Dev Biol. 2014. PMID: 24896658 Review.
-
Imprinted genes in the placenta--a review.Placenta. 2005 Apr;26 Suppl A:S10-20. doi: 10.1016/j.placenta.2004.12.009. Placenta. 2005. PMID: 15837057 Review.
Cited by
-
Biased Allele Expression and Aggression in Hybrid Honeybees may be Influenced by Inappropriate Nuclear-Cytoplasmic Signaling.Front Genet. 2015 Dec 1;6:343. doi: 10.3389/fgene.2015.00343. eCollection 2015. Front Genet. 2015. PMID: 26648977 Free PMC article.
-
A genetic map of Peromyscus with chromosomal assignment of linkage groups (a Peromyscus genetic map).Mamm Genome. 2014 Apr;25(3-4):160-79. doi: 10.1007/s00335-014-9500-8. Epub 2014 Jan 21. Mamm Genome. 2014. PMID: 24445420 Free PMC article.
-
Parent-of-origin growth effects and the evolution of hybrid inviability in dwarf hamsters.Evolution. 2014 Nov;68(11):3134-48. doi: 10.1111/evo.12500. Epub 2014 Sep 10. Evolution. 2014. PMID: 25130206 Free PMC article.
-
Peromyscus as a Mammalian epigenetic model.Genet Res Int. 2012;2012:179159. doi: 10.1155/2012/179159. Epub 2012 Mar 7. Genet Res Int. 2012. PMID: 22567379 Free PMC article.
-
Blood transcriptome analysis in a buck-ewe hybrid and its parents.Sci Rep. 2019 Nov 25;9(1):17492. doi: 10.1038/s41598-019-53901-z. Sci Rep. 2019. PMID: 31767945 Free PMC article.
References
-
- {'text': '', 'ref_index': 1, 'ids': [{'type': 'DOI', 'value': '10.1186/1477-7827-2-46', 'is_inner': False, 'url': 'https://doi.org/10.1186/1477-7827-2-46'}, {'type': 'PMC', 'value': 'PMC455692', 'is_inner': False, 'url': 'https://pmc.ncbi.nlm.nih.gov/articles/PMC455692/'}, {'type': 'PubMed', 'value': '15236656', 'is_inner': True, 'url': 'https://pubmed.ncbi.nlm.nih.gov/15236656/'}]}
- Carter AM, Enders AC (2004) Comparative aspects of trophoblast development and placentation. Reprod Biol Endocrinol 2, 46 - PMC - PubMed
-
- {'text': '', 'ref_index': 1, 'ids': [{'type': 'DOI', 'value': '10.1053/plac.2002.0887', 'is_inner': False, 'url': 'https://doi.org/10.1053/plac.2002.0887'}, {'type': 'PubMed', 'value': '12596737', 'is_inner': True, 'url': 'https://pubmed.ncbi.nlm.nih.gov/12596737/'}]}
- Cross JC, Baczyk D, Dobric N, Hemberger M, Hughes M, et al. (2003) Genes, development and evolution of the placenta. Placenta 24, 123–130 - PubMed
-
- {'text': '', 'ref_index': 1, 'ids': [{'type': 'DOI', 'value': '10.1098/rspb.2004.2725', 'is_inner': False, 'url': 'https://doi.org/10.1098/rspb.2004.2725'}, {'type': 'PMC', 'value': 'PMC1691726', 'is_inner': False, 'url': 'https://pmc.ncbi.nlm.nih.gov/articles/PMC1691726/'}, {'type': 'PubMed', 'value': '15306355', 'is_inner': True, 'url': 'https://pubmed.ncbi.nlm.nih.gov/15306355/'}]}
- Curley JP, Barton S, Surani A, Keverne EB (2004) Coadaptation in mother and infant regulated by a paternally expressed imprinted gene. Proc Biol Sci 271, 1303–1309 - PMC - PubMed
-
- {'text': '', 'ref_index': 1, 'ids': [{'type': 'PMC', 'value': 'PMC1206841', 'is_inner': False, 'url': 'https://pmc.ncbi.nlm.nih.gov/articles/PMC1206841/'}, {'type': 'PubMed', 'value': '8582624', 'is_inner': True, 'url': 'https://pubmed.ncbi.nlm.nih.gov/8582624/'}]}
- Darvasi A, Soller M (1995) Advanced intercross lines, an experimental population for fine genetic mapping. Genetics 141, 1199–1207 - PMC - PubMed
-
- {'text': '', 'ref_index': 1, 'ids': [{'type': 'DOI', 'value': '10.2307/2406294', 'is_inner': False, 'url': 'https://doi.org/10.2307/2406294'}]}
- Dawson WD (1965) Fertility and size inheritance in a Peromyscus species cross. Evolution 19, 44–55
Publication types
MeSH terms
Substances
LinkOut - more resources
Full Text Sources
Molecular Biology Databases
Research Materials
