. 2007 Jan;26(1):46-57.
doi: 10.1109/TMI.2006.884187.

Statistical analyses of brain surfaces using Gaussian random fields on 2-D manifolds

Affiliations

Statistical analyses of brain surfaces using Gaussian random fields on 2-D manifolds

Ravi Bansal et al. IEEE Trans Med Imaging. 2007 Jan.

Abstract

Interest in the morphometric analysis of the brain and its subregions has recently intensified because growth or degeneration of the brain in health or illness affects not only the volume but also the shape of cortical and subcortical brain regions, and new image processing techniques permit detection of small and highly localized perturbations in shape or localized volume, with remarkable precision. An appropriate statistical representation of the shape of a brain region is essential, however, for detecting, localizing, and interpreting variability in its surface contour and for identifying differences in volume of the underlying tissue that produce that variability across individuals and groups of individuals. Our statistical representation of the shape of a brain region is defined by a reference region for that region and by a Gaussian random field (GRF) that is defined across the entire surface of the region. We first select a reference region from a set of segmented brain images of healthy individuals. The GRF is then estimated as the signed Euclidean distances between points on the surface of the reference region and the corresponding points on the corresponding region in images of brains that have been coregistered to the reference. Correspondences between points on these surfaces are defined through deformations of each region of a brain into the coordinate space of the reference region using the principles of fluid dynamics. The warped, coregistered region of each subject is then unwarped into its native space, simultaneously bringing into that space the map of corresponding points that was established when the surfaces of the subject and reference regions were tightly coregistered. The proposed statistical description of the shape of surface contours makes no assumptions, other than smoothness, about the shape of the region or its GRF. The description also allows for the detection and localization of statistically significant differences in the shapes of the surfaces across groups of subjects at both a fine and coarse scale. We demonstrate the effectiveness of these statistical methods by applying them to study differences in shape of the amygdala and hippocampus in a large sample of normal subjects and in subjects with attention deficit/hyperactivity disorder (ADHD).


Figures

Fig. 1
Fig. 1
Surface analyses of the amygdala and hippocampus. Rows A-C: left amygdala and left hippocampus. Rows D-F: right amygdala and right hippocampus. Columns 1–4: group comparison using only the Student’s t-test computed on the β3 regression coefficient ((13)). Columns 5–8: group comparison using the t-statistic in conjunction with GRF theory. The color bar on the right shows the color encoding used. Red (violet) shows outward (inward) deviations in the surfaces of the group of 51 subjects with ADHD as compared with the surfaces of the group of 62 healthy individuals. The segmentation of the 3-D surfaces is shown using yellow lines. Rows A and D show the segmentation of the brain regions in 3-D space (Columns 1 & 5), the estimated 2-D discs (Columns 2 & 6), an example of a segmented 3-D section (Columns 3 & 7), and its corresponding flattened disc with a color mapping (columns 4 & 8). Rows B and E show color encoded p-values displayed across the entire surfaces of the reference regions while detecting statistically significant differences between the reference region and the group of 62 healthy individuals. Rows C and F show statistically significant differences between a group of 62 healthy individuals and a group of 51 subjects with ADHD. Two views of each region are shown: Columns 1 & 5 show the dorsal view of the amygdala; Columns 2 & 6 show the ventro-posterior view of the amygdala; Columns 3 & 7 show the ventral view of the hippocampus; Columns 4 & 8 show the dorsal view of the hippocampus.
Fig. 2
Fig. 2
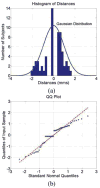
Distribution of signed euclidean distances for a group of 62 Healthy Individuals. Histogram (a) and QQ plot (b) of the estimated signed Euclidean distances for a group of 62 healthy individuals. Plots of random variables that are zero-mean, Gaussian-distributed with variance equal to sample variance are superimposed for comparison in (a). The kurtosis and skewness of the sets of distances are evaluated to study closeness of the sample to Gaussian distribution: Kurtosis = −0.6151, Skewness = −0.5428. The QQ plot show that the samples are derived from distribution that is close to the Gaussian distribution.
Fig. 3
Fig. 3
Expected Euler characteristics, E[χ(A(f, u))], as a function of the threshold U. The expected Euler characteristic was computed using the normalized GRF, over the left amygdala, for the group of 62 healthy individuals. Here, E[χ(A(f, u))] = 0.05 for u = 4.61, and E[χ(A(f, u))] = 0.2 for u = 3.67.
Fig. 4
Fig. 4
Effect of cut on the surface analysis of the left amygdala. We obtained a differing segmentation of the 3-D surface for the left amygdala using a set of parameters that segmented the surface into many pieces. Images from left to right: The segmentation of the left amygdala in 3-D space; the estimated 2-D discs; dorsal view of the left amygdala; ventral view of the left amygdala. The surface of the left amygdala was parameterized with a new segmentation of the 3-D surface that differed from the segmentation in Fig. 1, row A. Analyses using the new segmentation match well with the corresponding analysis in Fig. 1, row C.
Fig. 5
Fig. 5
Surface analysis without the curvature term to compute the expected euler characteristic (EC). In these analyses of the surface of the amygdala, the signed Euclidean distances were modeled as Gaussian random fields (GRFs). However, to study the effect of the curvature of surfaces on the computed expected EC, we set the curvature term (the first term on the right in ((4)) equal to zero. These analyses are more conservative than the analyses that account for the intrinsic curvature of surfaces to compute the expected EC (Fig. 1: Images C 5,6 and F 5,6).
Fig. 6
Fig. 6
Analyses with expected euler characteristic (EC) Computed for T-Field. Analyses of the surfaces of the amygdala and hippocampus for a group of 62 healthy individuals and 51 subjects with ADHD. For these analyses, we modeled the random field of signed Euclidean distances as a T-field on the surfaces of the brain regions. Top Row: Analyses for left amygdala and hippocampus. Bottom Row: Analyses for right amygdala and hippocampus. Because of the many (about 110) degrees of freedom for the T-field, these analyses match closely to the analyses for GRFs (Fig. 1).

References

    1. Van Essen D. A tension–based theory of morphogenesis and compact wiring in the central nernous system. Nature. 1997;385(6614):313–318. - PubMed
    1. Van Essen D, Drury H. Structural and functional analyses of human cerebral cortex using surface–based atlas. J Neurosci. 1997;17:7079–7102. - PMC - PubMed
    1. Thompson P, Giedd J, Woods R, MacDonald D, Evans A, Toga A. Growth patterns in the developing human brain detected using continuum–mechanical tensor mapping. Nature. 2000;404:190–193. - PubMed
    1. Sowell E, Peterson B, Thompson P, Welcome S, Henkenius A, Toga A. Mapping cortical change across the human life span. Nature Neurosci. 2003:309–315. - PubMed
    1. Shenton ME, Gerig G, McCarley RW, Szekely G, Kikinis R. Amygdala–hippocampal shape differences in schizophrenia: The application of 3-D shape models to volumetric MR data. Psychiatric Res Neuroimag. 2002;115:15–35. - PMC - PubMed

Publication types