Mitochondrial genome integrity mutations uncouple the yeast Saccharomyces cerevisiae ATP synthase
- PMID: 17244612
- PMCID: PMC3670140
- DOI: 10.1074/jbc.M609635200
Mitochondrial genome integrity mutations uncouple the yeast Saccharomyces cerevisiae ATP synthase
Abstract
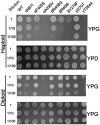
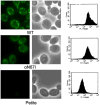
The mitochondrial ATP synthase is a molecular motor, which couples the flow of protons with phosphorylation of ADP. Rotation of the central stalk within the core of ATP synthase effects conformational changes in the active sites driving the synthesis of ATP. Mitochondrial genome integrity (mgi) mutations have been previously identified in the alpha-, beta-, and gamma-subunits of ATP synthase in yeast Kluyveromyces lactis and trypanosome Trypanosoma brucei. These mutations reverse the lethality of the loss of mitochondrial DNA in petite negative strains. Introduction of the homologous mutations in Saccharomyces cerevisiae results in yeast strains that lose mitochondrial DNA at a high rate and accompanied decreases in the coupling of the ATP synthase. The structure of yeast F1-ATPase reveals that the mgi residues cluster around the gamma-subunit and selectively around the collar region of F1. These results indicate that residues within the mgi complementation group are necessary for efficient coupling of ATP synthase, possibly acting as a support to fix the axis of rotation of the central stalk.
Figures


Similar articles
-
Specific mutations in alpha- and gamma-subunits of F1-ATPase affect mitochondrial genome integrity in the petite-negative yeast Kluyveromyces lactis.EMBO J. 1995 Jul 3;14(13):3277-86. doi: 10.1002/j.1460-2075.1995.tb07331.x. EMBO J. 1995. PMID: 7621839 Free PMC article.
-
Consequences of the pathogenic T9176C mutation of human mitochondrial DNA on yeast mitochondrial ATP synthase.Biochim Biophys Acta. 2010 Jun-Jul;1797(6-7):1105-12. doi: 10.1016/j.bbabio.2009.12.022. Epub 2010 Jan 4. Biochim Biophys Acta. 2010. PMID: 20056103 Free PMC article.
-
A "petite obligate" mutant of Saccharomyces cerevisiae: functional mtDNA is lethal in cells lacking the delta subunit of mitochondrial F1-ATPase.J Biol Chem. 2006 Jun 16;281(24):16305-13. doi: 10.1074/jbc.M513805200. Epub 2006 Apr 11. J Biol Chem. 2006. PMID: 16608846
-
Partial assembly of the yeast mitochondrial ATP synthase.J Bioenerg Biomembr. 2000 Aug;32(4):391-400. doi: 10.1023/a:1005532104617. J Bioenerg Biomembr. 2000. PMID: 11768301 Review.
-
The petite mutation in yeasts: 50 years on.Int Rev Cytol. 2000;194:197-238. doi: 10.1016/s0074-7696(08)62397-9. Int Rev Cytol. 2000. PMID: 10494627 Review.
Cited by
-
Nuclear modifier MTO2 modulates the aminoglycoside-sensitivity of mitochondrial 15S rRNA C1477G mutation in Saccharomyces cerevisiae.PLoS One. 2013 Dec 10;8(12):e81490. doi: 10.1371/journal.pone.0081490. eCollection 2013. PLoS One. 2013. PMID: 24339937 Free PMC article.
-
Molecular mechanism and energetics of coupling between substrate binding and product release in the F1-ATPase catalytic cycle.Proc Natl Acad Sci U S A. 2023 Feb 21;120(8):e2215650120. doi: 10.1073/pnas.2215650120. Epub 2023 Feb 13. Proc Natl Acad Sci U S A. 2023. PMID: 36780529 Free PMC article.
-
Single point mutations in ATP synthase compensate for mitochondrial genome loss in trypanosomes.Proc Natl Acad Sci U S A. 2013 Sep 3;110(36):14741-6. doi: 10.1073/pnas.1305404110. Epub 2013 Aug 19. Proc Natl Acad Sci U S A. 2013. PMID: 23959897 Free PMC article.
-
Understanding structure, function, and mutations in the mitochondrial ATP synthase.Microb Cell. 2015 Apr 1;2(4):105-125. doi: 10.15698/mic2015.04.197. Microb Cell. 2015. PMID: 25938092 Free PMC article.
-
Crystal structures of mutant forms of the yeast F1 ATPase reveal two modes of uncoupling.J Biol Chem. 2010 Nov 19;285(47):36561-9. doi: 10.1074/jbc.M110.174383. Epub 2010 Sep 14. J Biol Chem. 2010. PMID: 20843806 Free PMC article.
References
Publication types
MeSH terms
Substances
Grants and funding
LinkOut - more resources
Full Text Sources
Molecular Biology Databases

