

Review
doi: 10.1534/genetics.106.069963.
Applications of high-throughput RNA interference screens to problems in cell and developmental biology
Affiliations
- PMID: 17244760
- PMCID: PMC1775003
- DOI: 10.1534/genetics.106.069963
Item in Clipboard
Review
Applications of high-throughput RNA interference screens to problems in cell and developmental biology
Genetics.
2007 Jan.
Abstract
RNA interference (RNAi) in tissue culture cells has emerged as an excellent methodology for identifying gene functions systematically and in an unbiased manner. Here, we describe how RNAi high-throughput screening (HTS) in Drosophila cells are currently being performed and emphasize the strengths and weaknesses of the approach. Further, to demonstrate the versatility of the technology, we provide examples of the various applications of the method to problems in signal transduction and cell and developmental biology. Finally, we discuss emerging technological advances that will extend RNAi-based screening methods.
Figures
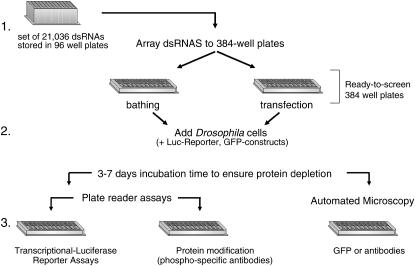
RNAi HTS platform. The three main steps in RNAi HTS are depicted: (1) arraying of the library to 384-well plates; (2) addition of Drosophila cells (10,000–40,000/well) and treatment with dsRNAs for 30 min in the absence of serum (bathing method) or with transfection reagents together with other DNA constructs (if needed); and (3) automated detection step (most commonly performed with a plate reader or an inverted epifluorescence microscope) to quantitate or monitor the effects of the dsRNAs in each well.
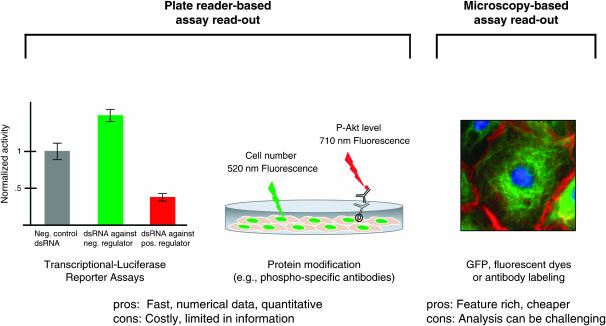
Common plate reader or microscopy readouts scored in cell-based assays. Plate-reader readouts: firefly luciferase expressed off a promoter sensitive to activation of a particular signal transduction pathway (e.g., Hh or Wg) is measured in each well. Normalization for cell number is achieved by dividing the firefly luciferase activity with that measured for Renilla luciferase typically expressed off a constitutive promoter [e.g., Pol III (Nybakken et al. 2005), actin 5C (Baeg et al. 2005), or copia (Lum et al. 2003)] insensitive to the signaling pathway. Protein modifications in response to activation of a signaling pathway or a specific stage of the cell cycle recognized by specific fluorescently coupled antibodies serve as excellent endogenous readouts that can be easily measured in plate readers (Friedman and Perrimon 2006) or by the Aerius imaging system (see text). Cell numbers (as measured with a variety of DNA fluorescent dyes) are used to normalize for each well the fluorescence value corresponding to the specific binding of the antibody to its epitope. Microscopy readouts: Cells in each well are imaged live or fixed and processed to visualize particular proteins, cytoskeletal structures, organelles, or subcellular compartments. GFP fusion proteins, fluorescently coupled antibodies (primary or secondary antibodies), and fluorescent dyes are routinely used to label the structure(s) of interest (Kiger et al. 2003; Eggert et al. 2004; Feske et al. 2006). The automated microscope has several filters that allow the acquisition of different fluorophores, enabling the capture of multiple features (high-content imaging). The cellular features are analyzed either by eye or through the use of commercially available or open source software packages.
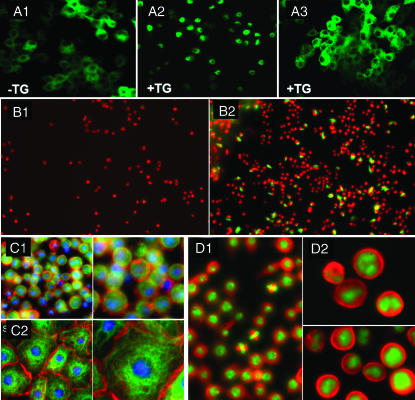
Example of visual cell-based assays. (A) Translocation of a nuclear factor of activated T cells (NFAT)–GFP fusion transcription factor (in green) to the nucleus in response to the opening of Ca2+ channels evoked by thapsigargin (TG). (A1) In the absence of TG, NFAT–GFP is cytoplasmic. (A2) Addition of TG to the cells leads to the rapid translocation of NFAT–GFP to the nucleus. (A3) Addition of dsRNA targeting olf186-F abrogates the translocation of NFAT–GFP in response to TG (Feske et al. 2006) (photographs are courtesy of Y. Gwack). (B) Cell-based assays that monitor the intracellular proliferation of a pathogen. Mycobacterium fortuitum engineered to express the GFP protein from the pmap24 promoter (only active when the bacteria has been internalized in the phagosome compartment) was added to S2 cells. (B1) Little GFP signal is detected 6 hr after infection as most of the bacteria have not entered the phagosome compartment. (B2) Successful infection by the bacteria and robust growth are observed 24 hr after addition of the pathogen to the cells. The GFP signal is quantitated using automated image analysis software to monitor the effect of the various dsRNAs on infection and growth of the pathogen (Philips et al. 2005). S2 nuclei are shown in red and bacteria in green (photographs are courtesy of J. Philips). (C) Round Kc cells (C1) and spread-out S2R+ cells (C2), shown in low and higher magnifications, can be used to study various aspects of cell morphology and adhesion (Kiger et al. 2003). Tubulin (green) was visualized with FITC-conjugated antitubulin antibody, actin (red) with tetramethyl rhodamine isothiocyanate (TRITC)–phalloidin, and DNA (blue) with DAPI (photographs are courtesy of A. Kiger). (D) A simple DNA stain can be used to screen for genes involved in cytokinesis. (D1) Untreated Drosophila Kc167 cells. (D2) Cells exposed to dsRNA targeting Aurora B kinase for 4 days. The cells are shown at low and higher magnifications. Cytoplasm (red) is stained with N-hydroxysuccinimide–tetramethylrhodamine and DNA (green) with Hoechst dye (photographs are courtesy of U. Eggert).
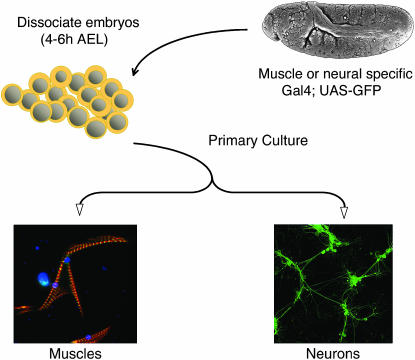
Applications of primary cell cultures to RNAi HTS. Embryos (4–6 hr after egg laying) are mechanically dissociated by douncing and the cell suspension cultured in the presence of dsRNA (bathing method) (J. Bai and N. Perrimon , unpublished results; K. J. Sepp , P. Hong , S. B. Lizarraga , J. S. Liu , L. A. Mejia , C. A. Walsh and N. Perrimon , unpublished results). Phenotypes in these cultures are typically read after 7–10 days. Cell-based assays in primary muscle and neuronal cells can be easily engineered by expressing a gene of interest using an appropriate Gal4 driver, e.g., dmef2-Gal4 for muscle or elav-Gal4 for neuronal cells. Primary cells can be visualized using specific antibody labeling or TRITC–phalloidin staining for muscle cells that reveals the sarcomeric structure of differentiated muscles or, as shown here for neurons, following the expression of GFP (elav-Gal4; UAS-GFP).
References
-
- Adams, M. D., S. E. Celniker, R. A. Holt, C. A. Evans, J. D. Gocayne et al., 2000. The genome sequence of Drosophila melanogaster. Science 287: 2185–2195. - PubMed
-
- Agaisse, H., L. S. Burrack, J. A. Philips, E. J. Rubin, N. Perrimon et al., 2005. Genome-wide RNAi screen for host factors required for intracellular bacterial infection. Science 309: 1248–1251. - PubMed
-
- Armknecht, S., M. Boutros, A. Kiger, K. Nybakken, B. Mathey-Prevot et al., 2005. High-throughput RNA interference screens in Drosophila tissue culture cells. Methods Enzymol. 392: 55–73. - PubMed
-
- Bard, F., L. Casano, A. Mallabiabarrena, E. Wallace, K. Saito et al., 2006. Functional genomics reveals genes involved in protein secretion and Golgi organization. Nature 439: 604–607. - PubMed
Publication types
MeSH terms
Grants and funding
LinkOut - more resources
Full Text Sources
Other Literature Sources
Molecular Biology Databases
Research Materials
