. 2007 Mar;150(5):613-23.
doi: 10.1038/sj.bjp.0707133. Epub 2007 Jan 22.

Cannabidiol displays unexpectedly high potency as an antagonist of CB1 and CB2 receptor agonists in vitro

Affiliations

Cannabidiol displays unexpectedly high potency as an antagonist of CB1 and CB2 receptor agonists in vitro

A Thomas et al. Br J Pharmacol. 2007 Mar.

Abstract

Background and purpose: A nonpsychoactive constituent of the cannabis plant, cannabidiol has been demonstrated to have low affinity for both cannabinoid CB1 and CB2 receptors. We have shown previously that cannabidiol can enhance electrically evoked contractions of the mouse vas deferens, suggestive of inverse agonism. We have also shown that cannabidiol can antagonize cannabinoid receptor agonists in this tissue with a greater potency than we would expect from its poor affinity for cannabinoid receptors. This study aimed to investigate whether these properties of cannabidiol extend to CB1 receptors expressed in mouse brain and to human CB2 receptors that have been transfected into CHO cells.

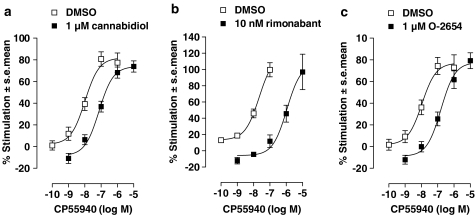
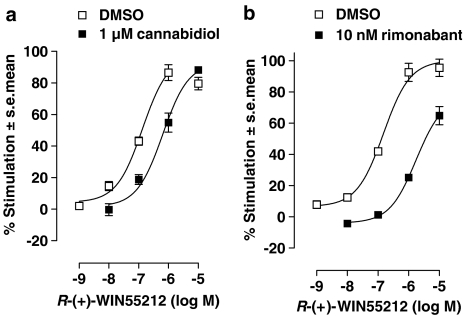
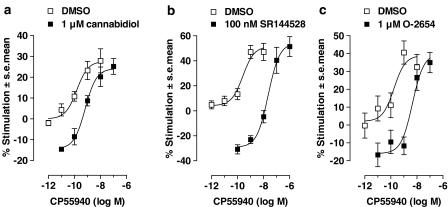
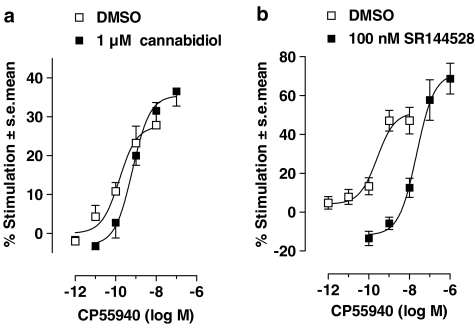
Experimental approach: The [35S]GTPS binding assay was used to determine both the efficacy of cannabidiol and the ability of cannabidiol to antagonize cannabinoid receptor agonists (CP55940 and R-(+)-WIN55212) at the mouse CB1 and the human CB2 receptor.

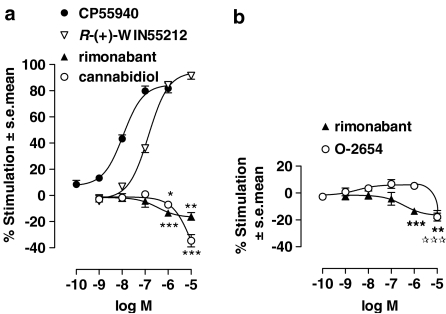
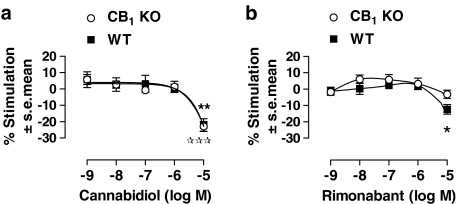
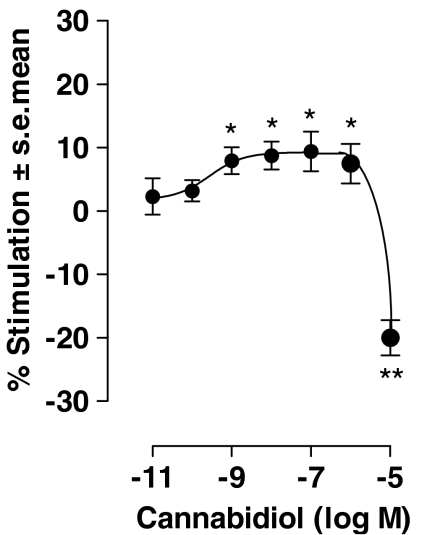
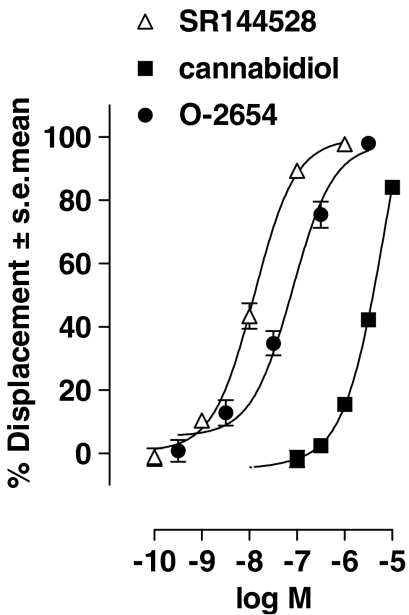
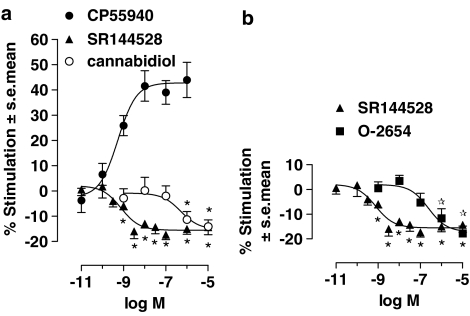
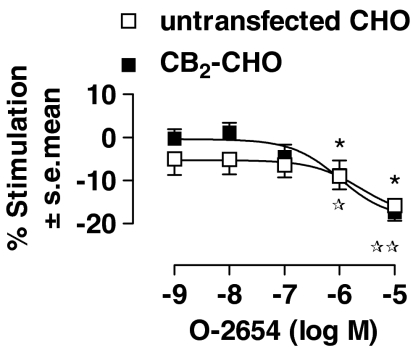
Key results: This paper reports firstly that cannabidiol displays inverse agonism at the human CB2 receptor. Secondly, we demonstrate that cannabidiol is a high potency antagonist of cannabinoid receptor agonists in mouse brain and in membranes from CHO cells transfected with human CB2 receptors.

Conclusions and implications: This study has provided the first evidence that cannabidiol can display CB2 receptor inverse agonism, an action that appears to be responsible for its antagonism of CP55940 at the human CB2 receptor. The ability of cannabidiol to behave as a CB2 receptor inverse agonist may contribute to its documented anti-inflammatory properties.


Figures

Figure 1
Figure 1
[35S]GTPγS binding to mouse brain membranes. The effect of (a) 1 μM cannabidiol (n=4–5), (b) 10 nM rimonabant (n=4) or (c) 1 μM O-2654 (n=5) on the mean log concentration–response curve of CP55940 for stimulation of [35S]GTPγS binding to mouse whole-brain membranes. Each symbol represents the mean percentage increase in [35S]GTPγS binding±s.e.m. Mean apparent KB values of these cannabinoids for their antagonism of CP55940 have been calculated from these data and are listed in Table 1.
Figure 2
Figure 2
[35S]GTPγS binding to mouse brain membranes. The effect of (a) 1 μM cannabidiol (n=6) or (b) 10 nM rimonabant (n=5) on the mean log concentration–response curve of R-(+)-WIN55212 for stimulation of [35S]GTPγS binding to mouse whole-brain membranes. Each symbol represents the mean percentage increase in [35S]GTPγS binding±s.e.m. The mean apparent KB values of cannabidiol or rimonabant for their antagonism of R-(+)-WIN55212, with 95% CI in parantheses were 0.3 nM (0.16 and 0.52 nM) and 138 nM (87 and 225 nM), respectively.
Figure 3
Figure 3
[35S]GTPγS binding to mouse brain membranes. The effect of (a) CP55940 (n=9), R-(+)-WIN55212 (n=7–8), rimonabant (n=7–8) and cannabidiol (n=6) or (b) rimonabant (n=7–8) and O-2654 (n=6–10) on the level of [35S]GTPγS binding to mouse whole-brain membranes. Each symbol represents the mean percentage change in [35S]GTPγS binding±s.e.m. In (a), asterisks (*) denote rimonabant and cannabidiol values and in (b), asterisks (*) or open stars (⋆) denote rimonabant or O-2654 values, respectively, which are significantly different from zero (*P<0.05, **P<0.005, ***P<0.001; one-sample t-test). The mean EC50 and Emax values of these cannabinoids are listed in Table 2.
Figure 4
Figure 4
[35S]GTPγS binding to mouse brain membranes. The effect of (a) cannabidiol (n=5–6) or (b) rimonabant (n=6) on the level of [35S]GTPγS binding to mouse whole-brain membranes prepared from either C57BL/6 mice whose CB1 receptors had been genetically deleted (open circles) or their WT littermates (filled squares). Values represent the mean percentage inhibition of [35S]GTPγS binding±s.e.m.. Asterisks (*) or open stars (⋆) denote values obtained from WT or CB1 KO membranes, respectively, which are significantly different from zero (*P<0.01, **P<0.005, ***P<0.001; one-sample t-test). The response induced by 10 μM rimonabant in mouse brain membranes prepared from CB1−/− mice differed significantly to that induced in mouse brain membranes prepared from the WT littermates (*P<0.05; Student's t-test; n=6).
Figure 5
Figure 5
[35S]GTPγS binding to hCB1-CHO cell membranes. The effect of cannabidiol (n=5–15) on the level of [35S]GTPγS binding to CB1 transfected CHO cell membranes. Each symbol represents the mean percentage increase in [35S]GTPγS binding±s.e.m.. Asterisks (*) denote values obtained, which are significantly different from zero (*P<0.05, **P<0.001; one-sample t-test).
Figure 6
Figure 6
Displacement of [3H]CP55940 from hCB2-CHO cell membranes. The ability of SR144528, cannabidiol or O-2654 to displace [3H]CP55940 from specific binding sites in hCB2-CHO cell membranes. Each symbol represents the mean percent displacement±s.e.m. The mean Ki values for this displacement were calculated by the Cheng–Prusoff equation and are listed in Table 1.
Figure 7
Figure 7
[35S]GTPγS binding to membranes from hCB2-CHO cell membranes. The effect of (a) 1 μM cannabidiol (n=4–5), (b) 100 nM SR144528 (n=5–6) or (c) 1 μM O-2654 (n=3–5) on the mean log concentration–response curve of CP55940 for stimulation of [35S]GTPγS binding to CB2-transfected CHO cell membranes. Each symbol represents the mean percentage increase in [35S]GTPγS binding±s.e.m. Mean apparent KB values of these cannabinoids for their antagonism of CP55940 have been calculated from these data and are listed in Table 1.
Figure 8
Figure 8
[35S]GTPγS binding to membranes from hCB2-CHO cell membranes. The effect of (a) CP55940 (n=6–12), SR144528 (n=5) and cannabidiol (n=8) or (b) SR144528 (n=5) and O-2654 (n=6) on the level of [35S]GTPγS binding to CB2 transfected CHO cell membranes. Each symbol represents the mean percentage change in [35S]GTPγS binding±s.e.m. In (a), asterisks (*) denote SR144528 and cannabidiol values and in (b), asterisks (*) or open stars (⋆) denote SR144528 or O-2654 values, respectively, which are significantly different from zero (*P<0.05; one-sample t-test). The mean EC50 and Emax values of these cannabinoids are listed in Table 2.
Figure 9
Figure 9
[35S]GTPγS binding to membranes from untransfected cells or cells transfected with human CB2 receptors. The effect of O-2654 on the level of [35S]GTPγS binding to untransfected CHO cell membranes (n=6) or CB2-transfected CHO cell membranes (n=8). Each symbol represents the mean percentage change in [35S]GTPγS binding±s.e.m. Asterisks (*) or open stars (⋆) denote values obtained from CB2-transfected CHO cell membranes or untransfected cell membranes, respectively, which are significantly different from zero (*P<0.05, **P<0.01; one-sample t-test).
Figure 10
Figure 10
[35S]GTPγS binding to membranes from hCB2-CHO cell membranes. The effect of (a) 1 μM cannabidiol (n=4–5) or (b) 100 nM SR144528 (n=5–6) on the mean log concentration–response curve of CP55940 for stimulation of [35S]GTPγS binding to CB2-transfected CHO cell membranes after subtraction of the inhibitory effect induced by either 1 μM cannabidiol or 100 nM SR144528 at the basal level of [35S]GTPγS binding, determined in the absence of any other compound. Each symbol represents the mean percentage increase in [35S]GTPγS binding±s.e.m. After this re-analysis, it was found that 1 μM cannabidiol did not produce a significant rightward shift of the CP55940 log concentration–response curve, whereas 100 nM SR144528 antagonized CP55940 with an apparent KB value of 2.5 nM, with 95% CI of 1.6 and 4.3 nM.

References

    1. Bisogno T, Hanus L, De Petrocellis L, Tchilibon S, Ponde DE, Brandi I, et al. Molecular targets for cannabidiol and its synthetic analogues: effect on vanilloid VR1 receptors and on the cellular uptake and enzymatic hydrolysis of anandamide. Br J Pharmacol. 2001;134:845–852. - PMC - PubMed
    1. Bouaboula M, Desnoyer N, Carayon P, Combes T, Casellas P. Gi protein modulation induced by a selective inverse agonist for the peripheral cannabinoid receptor CB2: implication for intracellular signalization cross-regulation. Mol Pharmacol. 1999;55:473–480. - PubMed
    1. Breivogel CS, Griffin G, Di Marzo V, Martin BR. Evidence for a new G protein-coupled cannabinoid receptor in mouse brain. Mol Pharmacol. 2001;60:155–163. - PubMed
    1. Carrier EJ, Auchampach JA, Hillard CJ. Inhibition of an equilibrative nucleoside transporter by cannabidiol: a mechanism of cannabinoid immunosuppression. Proc Nat Acad Sci USA. 2006;103:7895–7900. - PMC - PubMed
    1. Cheng YC, Prusoff WH. Relationship between the inhibition constant (KI) and the concentration of inhibitor which causes 50 percent inhibition (IC50) of an enzymatic reaction. Biochem Pharmacol. 1973;22:3099–3108. - PubMed

Publication types

MeSH terms

Substances