Review
. 2007 Mar;150(5):541-51.
doi: 10.1038/sj.bjp.0706997. Epub 2007 Jan 22.

Taking the time to study competitive antagonism

Affiliations
Review

Taking the time to study competitive antagonism

D J A Wyllie et al. Br J Pharmacol. 2007 Mar.

Abstract

Selective receptor antagonists are one of the most powerful resources in a pharmacologist's toolkit and are essential for the identification and classification of receptor subtypes and dissecting their roles in normal and abnormal body function. However, when the actions of antagonists are measured inappropriately and misleading results are reported, confusion and wrong interpretations ensue. This article gives a general overview of Schild analysis and the method of determining antagonist equilibrium constants. We demonstrate why this technique is preferable in the study of competitive receptor antagonism than the calculation of antagonist concentration that inhibit agonist-evoked responses by 50%. In addition we show how the use of Schild analysis can provide information on the outcome of single amino acid mutations in structure-function studies of receptors. Finally, we illustrate the need for caution when studying the effects of potent antagonists on synaptic transmission where the timescale of events under investigation is such that ligands and receptors never reach steady-state occupancy.


Figures

Figure 1
Figure 1
Methods for calculating IC50 and KB Values. (a) Reaction scheme, based on the del Castillo–Katz mechanism, which incorporates the mutually exclusive binding of two different ligands denoted as A (agonist) and B (antagonist). In this scheme, the receptor can exist in one of three inactive states – unbound (R), bound by agonist (AR) and bound by antagonist (BR) and one active state (AR*). The equilibrium constant for agonist binding is given by KA, whereas that for antagonist binding is given by KB. The equilibrium constant for the isomerization reaction is denoted by E. For the simulations shown in the remaining panels the following equilibrium constants are used: KA=KB=10 μM and E=10. The plot below the reaction scheme shows the concentration–response curve (in terms of the occupancy of the AR* state, pAR*) that would be obtained in the absence of antagonist. It predicts a maximum response (pmax) of 0.909 and an EC50 for the agonist of 0.909 μM. (b) A series of inhibition curves predicted from the reaction scheme shown in (a), with the normalized agonist concentration, cA, set to be equal to 0.1, 0.3, 1, 3 and 10. For each curve, responses have been normalized to the predicted maximal response (in the absence of antagonist) for each agonist concentration used. The dashed lines indicate the predicted IC50 values that would be obtained for each agonist concentration. (c) A series of concentration–response curves that are predicted from the scheme shown in (a), in the absence (black curve) and presence (coloured curves) of antagonist. Note that increasing the antagonist concentrations results in a parallel shift to the right of the concentration–response curve; however, the maximum response that can be achieved is equivalent whether or not antagonist is present. The dashed lines indicate the predicted EC50 values that would be obtained under each condition. (d) Schild plot resulting from the analysis of the data represented in (c). The data points (colour-coded corresponding to the dose ratios obtained from the curves in (c)) fall on a straight line whose slope is equal to one. The intercept of this line with the abscissa (indicated by the dashed horizontal line) gives the KB value for the antagonist.
Figure 2
Figure 2
Comparison of IC50 and KB values of a competitive antagonist at two NMDA receptor subtypes. (a) Mean inhibition curves to determine the IC50 of NVP-AAM077 acting at NR1/NR2A NMDARs and obtained when either 3 μM (=EC50) glutamate (red curve) or 30 μM (=10EC50) glutamate (blue curve) was used to activate NR1/NR2A NMDA receptors. Values of the IC50 for NVP-AAM077 are 31 nM (for 3 μM glutamate) and 215 nM (for 30 μM glutamate). The curve shown as a dotted red line indicates the inhibition curve obtained when NMDA, rather than glutamate, was used as the agonist. Notice that NVP-AAM077 is more potent at inhibiting NR1/NR2A NMDARs activated by an EC50 concentration of NMDA than it is at inhibiting responses evoked by glutamate at its EC50 concentration. (b) Mean inhibition curves to determine the IC50 of NVP-AAM077 acting at NR1/NR2B NMDARs and obtained when either 1.5 μM (=EC50) glutamate (red curve) or 15 μM (=10EC50) glutamate (blue curve) was used to activate NR1/NR2A NMDARs. Values of the IC50 for NVP-AAM077 are 215 nM (for 1.5 μM glutamate) and 2.2 μM (for 15 μM glutamate). The curve shown as a dotted red line indicates the inhibition curve obtained when NMDA, rather than glutamate, was used as the agonist. Notice that NVP-AAM077 is less potent at inhibiting NR1/NR2B NMDARs activated by an EC50 concentration of NMDA than it is at inhibiting responses evoked by glutamate at its EC50 concentration. (c) Upper panel, example of partial, low-concentration, glutamate concentration–response curves used to estimate dose ratios and obtained from an oocyte expressing NR1/NR2A NMDARs. The slope of the fitted line to the control responses (no NVP-AAM077) was constrained and used to fit the responses obtained in the presence of 30, 100, 300 nM and 1 μM NVP-AAM077. Lower panel, example of partial, low-concentration, glutamate concentration–response curves used to estimate dose ratios and obtained from an oocyte expressing NR1/NR2B NMDARs. Again, the slope of the fitted line to the control responses was constrained and used to fit the responses obtained in the presence of 300 nM, 1 μM and 3 μM NVP-AAM077. (d) Schild plot for antagonism of NR1/NR2A and NR1/NR2B NMDARs by NVP-AAM077 using dose ratios estimated from a series of experiments such as those illustrated in (c). The solid lines show fits of the data points to the Schild equation (i.e., the slopes are equal to unity). The intercept on the abscissa (where the log10 value of the dose ratio equals zero) gives a KB value for NVP-AAM077 of 15 nM for NR1/NR2A NMDARs and 78 nM for NR1/NR2B NMDARs. Data adapted and reproduced, with permission, from Frizelle et al. (2006) ©2006 American Society for Pharmacology and Experimental Therapeutics.
Figure 3
Figure 3
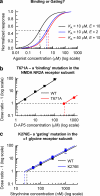
The ‘binding-gating' problem – using competitive antagonists to investigate the effects of mutations. (a) Concentration–response curve (black-coloured line) predicted from the reaction scheme shown in Figure 1a. The blue- and red-coloured curves show the effect of altering either the equilibrium constant for the gating reaction (blue) or binding reaction (red). In each case, a consequence of these changes is to reduce agonist potency. (b) Schild plot illustrating the action of D-AP5 acting at recombinant NR1/NR2A NMDARs expressed in X. laevis oocytes. The point mutation NR2A(T671A) results in an increase in the KB of the antagonist from 1.3 μM (WT) to 321 μM (mutant). (c) Schild plot illustrating the action of strychnine acting at recombinant α1 glycine receptors expressed in X. laevis oocytes. The point mutation α1(K276E) does not significantly alter the KB of the antagonist when compared to its action at α1(WT) receptors (KB=28 nM (WT); KB=23 nM (α1(K276E)). Data in (b) reproduced, with permission, from Anson et al. (1998) ©1998 Society for Neuroscience and data in (c) kindly supplied by D Colquhoun (Pharmacology, UCL) and reproduced, with permission, from Lewis et al. (1998), ©1998 Blackwell Publishing.
Figure 4
Figure 4
Reducing the duration of agonist application increases antagonist potency. (a) Kinetic scheme used to simulate ‘synaptic' responses illustrated in (b). In the reaction scheme, each receptor subunit (denoted by R) can be occupied by either agonist (A) or antagonist (B). The doubly liganded A2R state undergoes two conformation changes before channel opening (A2R*; for further details see Banke and Traynelis, 2003; Erreger et al., 2005). Two desensitized states also exist (D1 and D2). The rate constants used in the simulation were: k+A=2.83 μM−1 s−1; k–A=31.8 s−1; kD1+=85.1 s−1; kD1–=29.7 s−1; kD2+=230 s−1; kD2−=1.01 s−1; ks+=230 s−1; ks−=178 s−1; kf+=3140 s−1; kf−=174 s−1; k+B=10 μM−1 s−1 and k−B=0.15 s−1. (b) Output of the kinetic scheme shown in (a) when 1000 channels with a conductance of 50 pS (i.e., equivalent to a single-channel amplitude of −5 pA, when the driving force is equal to −100 mV) are activated by 1 ms application of agonist (10 mM). The black trace shows the response in the absence of antagonist while the responses evoked by the agonist in the presence of 3, 30 and 300 nM antagonist are indicated by the green, red and blue curves respectively. (c) Equivalent simulation as shown in (b), but with the agonist application increased to 60 s. Notice that in each case a maximal steady-state response can be achieved although the rate at which this equilibrium is reached is dependent on the antagonist concentration. (d) Equivalent simulation to that shown in (c) with the exception that the agonist concentration has been reduced to 3 μM. In this example the steady-state level of the current is reduced in an antagonist concentration-dependent manner.

References

    1. Anson LC, Chen PE, Wyllie DJA, Colquhoun D, Schoepfer R. Identification of amino acid residues of the NR2A subunit that control glutamate potency in recombinant NR1/NR2A NMDA receptors. J Neurosci. 1998;18:581–589. - PMC - PubMed
    1. Arunlakshana O, Schild HO. Some quantitative uses of drug antagonists. Br J Pharmacol Chemother. 1959;14:48–57. - PMC - PubMed
    1. Banke TG, Traynelis SF. Activation of NR1/NR2B NMDA receptors. Nat Neurosci. 2003;6:144–152. - PubMed
    1. Black JW.Drugs from emasculated hormones: the principles of syntopic antagonism Noble Lectures, Physiology or Medicine 1981–1990 1993World Scientific Publishing Co.: Singapore; In: Frängsmyr T, Lindsten J (eds)
    1. Black JW, Duncan WAM, Durant CJ, Ganelin CR, Parsons EM. Definition and antagonism of histamine H2-receptors. Nature. 1972;236:385–390. - PubMed

Publication types

MeSH terms