. 2007 Jan 24;2(1):e167.
doi: 10.1371/journal.pone.0000167.

Increased anxiety-like behavior and enhanced synaptic efficacy in the amygdala of GluR5 knockout mice

Affiliations

Increased anxiety-like behavior and enhanced synaptic efficacy in the amygdala of GluR5 knockout mice

Long-Jun Wu et al. PLoS One. .

Abstract

GABAergic transmission in the amygdala modulates the expression of anxiety. Understanding the interplay between GABAergic transmission and excitatory circuits in the amygdala is, therefore, critical for understanding the neurobiological basis of anxiety. Here, we used a multi-disciplinary approach to demonstrate that GluR5-containing kainate receptors regulate local inhibitory circuits, modulate the excitatory transmission from the basolateral amygdala to the central amygdala, and control behavioral anxiety. Genetic deletion of GluR5 or local injection of a GluR5 antagonist into the basolateral amygdala increases anxiety-like behavior. Activation of GluR5 selectively depolarized inhibitory neurons, thereby increasing GABA release and contributing to tonic GABA current in the basolateral amygdala. The enhanced GABAergic transmission leads to reduced excitatory inputs in the central amygdala. Our results suggest that GluR5 is a key regulator of inhibitory circuits in the amygdala and highlight the potential use of GluR5-specific drugs in the treatment of pathological anxiety.


Conflict of interest statement

Competing Interests: The authors have declared that no competing interests exist.

Figures

Figure 1
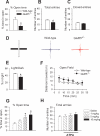
Figure 1. Anxiety-like behavior in GluR5−/− mice.
(A) GluR5−/− mice (n = 17) spent significantly less time in the open arms of the EPM compared to wild-type mice (n = 10). (B) The total number of arm entries (open+closed) was decreased in GluR5−/− mice but there was no difference in closed arm entries (C) between genotypes. (D) From left to right: Diagram of the EPM, filled boxes = closed arms, open boxes = open arms; representative traces showing the movement of wild-type and GluR5−/− mice in the EPM for 5 mins. (E) GluR5−/− mice (n = 8) spent significantly less time in the light half of the chamber compared to wild-type mice (n = 6). (F) No significant difference was detected in the distance traveled in the open field. * P<0.05. (G) While open arm exploration was not affected by 1 mg/kg ATPA (n = 5), 5.0 mg/kg (n = 7) and 10.0 mg/kg (n = 10) ATPA significantly increased the time spent in the open arms compared to mice receiving saline (n = 9). (H) There was no difference in the number of total arm entries across treatment groups.
Figure 2
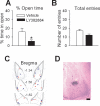
Figure 2. Pharmacological inhibition of GluR5 receptors in the amygdala affected behavioral anxiety.
(A) Mice injected with LY382884 (n = 7, 4 µg/µl) spent significantly less time in the open arms of the EPM compared to vehicle injected mice (n = 8). (B) There was no difference in the number of total arm entries between groups. (C) Cannula tip placement in mice injected with Vehicle (blue circles) or LY382884 (red squares) in the BLA. (D) Representative coronal section showing the BLA injection site (scale bar 0.6 mm). * P<0.05.
Figure 3
Figure 3. Activation of GluR5 increased neuronal excitability in interneruons but decreased excitability in pyramidal neurons.
(A) Schematic organization of a parasagittal hemisection through a mouse brain depicting the approximate anatomical location where immunocytochemistry was conducted. (B and C) Nissl-stained coronal section through the BLA of representative wild-type (B) and GluR5−/− (C) mice. No obvious anatomical differences between these two strains were detected. (D and E) ATPA (3 µM)-induced current in interneurons (n = 5) is significantly larger than that observed in pyramidal neurons (n = 6). (F) Interneurons were identified by their morphology and firing properties. Lucifer yellow (0.1%) was loaded through the patch pipette and confocal images were obtained after recording. A representative interneuron is shown in the inset (scale bar, 20 µM). When injected with current steps that ranged from −100 pA to 100 pA within 400 ms, interneurons showed fast spiking properties (top trace). In the same neuron, bath application of ATPA (3 µM) induced neuronal depolarization and firing of the interneuron (lower trace). Resting membrane potential for this neuron is −52.3 mV and holding current is 18.5 pA. (G) Pyramidal neurons showed different firing properties from those observed in interneurons after current injection (top trace; representative shown in the inset, scale bar, 20 µM). In the same neuron, bath-application of ATPA (3 µM) induced hyperpolarization and reduced the neuronal firing (lower trace). Resting membrane potential for this neuron was −66.6 mV and the holding current was 66.9 pA. (H) Pooled data showed that ATPA (3 µM) increased firing rate of interneurons (n = 6) while decreased that of pyramidal neurons (n = 5). Bath application of picrotoxin (100 µM) completely blocked the effect of ATPA in pyramidal neurons but not in interneurons. (I) Bath application of picrotoxin (100 µM) completely abolished the hyperpolarization in pyramidal neurons (n = 5) but not depolarization in interneurons (n = 5) induced by ATPA (3 µM). * P<0.05, **P<0.01.
Figure 4
Figure 4. Activation of GluR5 by ATPA reversibly increased sIPSCs but not sEPScs or mIPSCs.
(A) A representative example of ATPA (3 µM) modulation of sIPSCs in a BLA pyramidal neuron. The top trace represents sIPSCs recorded before, during and after ATPA application. The bottom 3 traces are presented at an expanded scale. (B and C) Time course for the ATPA-induced enhancement of sIPSC frequency and amplitude in the neuron shown in (A). Note the effect of ATPA is reversible. (D) The facilitatory effect of ATPA on sIPSC frequency is concentration dependent (0.03 µM, n = 6; 0.3 µM, n = 5; 3 µM, n = 7). (E) The effect of ATPA (3 µM) could be blocked by LY293558 (30 µM, n = 4) or in GluR5−/− mice (n = 4), suggesting that the ATPA's action is mediated by GluR5. *Indicates a significant difference from control without treatment of ATPA. (F and G) ATPA (3 µM) had little effect on either frequency or amplitude of sEPSCs (n = 5). (H and I) A representative trace (F) and time course of drug effect (G) showing that TTX (1 µM) fully reversed the enhancement of sIPSC induced by ATPA treatment (3 µM). Similar results were obtained from an additional 4 neurons. (J and K) In the presence of TTX (1 µM), ATPA did not affect either amplitude or frequency of mIPSCs. Three concentrations of ATPA were used and none had significant effects on sIPSC frequency or amplitude (0.1 µM, n = 7; 0.3 µM, n = 6; and 3 µM, n = 7).
Figure 5
Figure 5. Endogenous activation of GluR5 increases GABA release and tonic GABA current in the BLA.
(A) Representative traces of LY293558 (30 µM) modulation of sIPSCs in a BLA pyramidal neuron. (B) Cumulative probability plot showing that LY293558 application decreased sIPSC frequency in the neuron showed in (A). (C) Pooled data showing that LY293558 reduced the frequency of sIPSCs in wild-type mice. GluR5−/− showed the decreased sIPSC frequency compared that in wild-type mice. * P<0.05 compare with GluR5−/− mice, # P<0.05 compared with control without LY293558 application in wild-type mice. (D) Perfusion of bicuculline (10 µM) induced a baseline shift (the tonic GABA current) in BLA neurons from both wild-type and GluR5−/− mice. (E) Tonic GABAergic current was reduced in BLA pyramidal neurons of GluR5−/− mice (wild-type, n = 12; GluR5−/−, n = 11). In the presence of LY293558 (30 µM), tonic GABA current was also significantly reduced (n = 9). * P<0.05 compare with GluR5−/− mice, # P<0.01 compared with control without LY293558 application in wild-type mice. (F) Bath application of TTX (1 µM) induced tonic GABAergic current in wild-type mice (n = 8). In GluR5−/− mice (n = 8), the TTX-induced tonic current is smaller than that in wild-type mice. Further application of bicuculline caused the similar tonic current in both mice. * P<0.05.
Figure 6
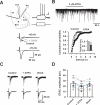
Figure 6. Activation of GluR5 in the BLA affected the output to the CeM in the amygdala.
(A) Diagram showing the placement of the stimulating electrode (Sti) and drug puff-application pipette (Puff) in the BLA as well as recording electrode (Rec) in the CeM (left). A typical late-firing neuron showed the delayed firing properties in respond to current steps that from −50 pA to 75 pA within 400 ms (right). Resting membrane potential for this neuron is −63.3 mV. Scale bar, 15 mV and 80 ms. Lower traces showing evoked responses in a CeM neuron by electric stimulation in the BLA. At holding potential of −45 mV, biphasic responses were observed and CNQX application could block both of them. At holding potential of −70 mV, only inward current was observed. (B) Typical recording and cumulative probability plot showing that ATPA (3 µM) application in the BLA decreased sEPSCs in a CeM late-firing neuron. Inset: Relative frequency (freq.) during ATPA application was significantly decreased (n = 6). (C) Typical traces showing that after puff application of ATPA (3 µM) in the BLA, eEPSCs recorded in a CeM neuron were decreased. (D) Individual experiments and statistical results showing that ATPA reduced eEPSC amplitude (n = 7, each neuron represented by a separate symbol). * P<0.05, **P<0.01.
Figure 7
Figure 7. GluR5−/− mice exhibit less synaptic efficacy from the BLA to CeM, but no change long-term potentiation.
(A) Typical samples showing eEPSCs recorded in CeM neurons by stimulation in the BLA in wild-type and GluR5−/− mice. The stimulation intensities range from 4 V to 10 V. (B) Input-output curve of eEPSCs indicated that at lower stimulation intensity, eEPSCs in wild-type mice were significantly smaller than those in GluR5−/− mice. No difference was found at a higher stimulation intensity (wild-type, n = 8; GluR5−/−, n = 7). (C) Local application of LY382884 (10 µM) has similar effect on input-output curve of eEPSC to that in GluR5−/− mice, increasing weak stimulation-induced eEPSCs (n = 8). (D and E) LTP could be induced in CeM neurons by theta burst stimulation in the BLA from wild-type mice (n = 8) or GluR5−/− mice (n = 8). There was no significant difference in potentiation between groups. The dashed line indicates the mean basal synaptic responses and the arrow shows the time point of LTP induction. *P<0.05.

Similar articles

Cited by

References

    1. Sandford JJ, Argyropoulos SV, Nutt DJ. The psychobiology of anxiolytic drugs. Part 1: Basic neurobiology. Pharmacol Ther. 2000;88:197–212. - PubMed
    1. Rosen JB, Schulkin J. From normal fear to pathological anxiety. Psychol Rev. 1998;105:325–350. - PubMed
    1. Greenberg PE, Sisitsky T, Kessler RC, Finkelstein SN, Berndt ER, et al. The economic burden of anxiety disorders in the 1990s. J Clin Psychiatry. 1999;60:427–435. - PubMed
    1. Gross C, Hen R. The developmental origins of anxiety. Nat Rev Neurosci. 2004;5:545–552. - PubMed
    1. Davis M. The role of the amygdala in fear and anxiety. Annu Rev Neurosci. 1992;15:353–375. - PubMed

Publication types

MeSH terms