

A relative color approach to color discrimination for malignant melanoma detection in dermoscopy images
- PMID: 17250534
- PMCID: PMC3184887
- DOI: 10.1111/j.1600-0846.2007.00192.x
A relative color approach to color discrimination for malignant melanoma detection in dermoscopy images
Abstract
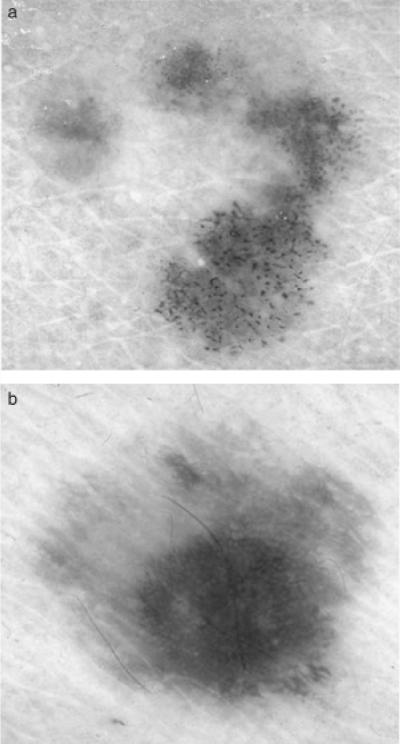
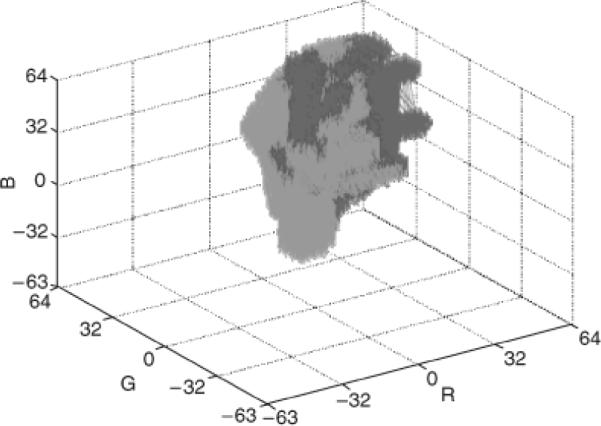
Background: Skin lesion color is an important feature for diagnosing malignant melanoma. In previous research, skin lesion color was investigated for discriminating malignant melanoma lesions from benign lesions in clinical images. Colors characteristics of melanoma were determined using color histogram analysis over a training set of images. Percent melanoma color and color clustering ratio features were used to quantify the presence of melanoma-colored pixels within skin lesions for skin lesion discrimination.
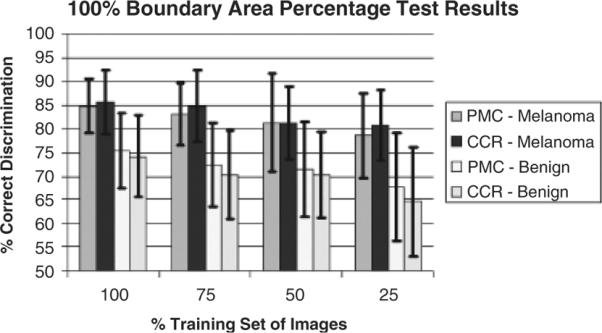
Methods: In this research, the relative color histogram analysis technique is used to evaluate skin lesion discrimination based on color feature calculations in different regions of the skin lesion in dermoscopy images. The histogram analysis technique is examined for varying training set sizes from the set of 113 malignant melanomas and 113 benign dysplastic nevi images.
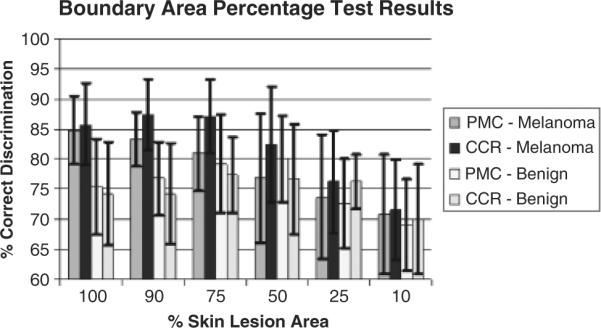
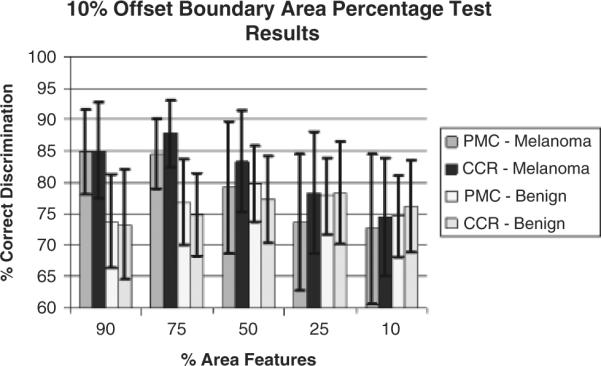
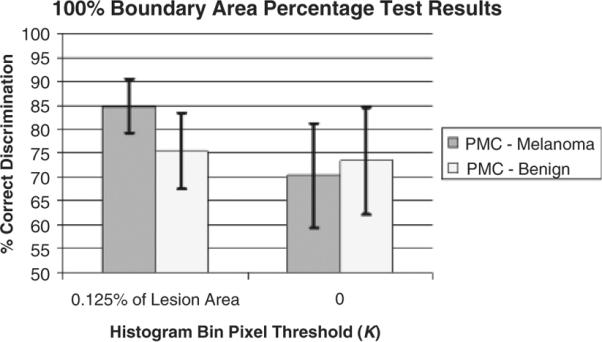
Results: Experimental results show improved discrimination capability for feature calculations focused in the interior lesion region. Recognition rates for malignant melanoma and dysplastic nevi as high as 87.7% and 74.9%, respectively, are observed for the color clustering ratio computed using the outer 75% uniformly distributed area with a 10% offset within the boundary.
Conclusions: Experimental results appear to indicate that the melanoma color feature information is located in the interior of the lesion, excluding the 10% central-most region. The techniques presented here including the use of relative color and the determination of benign and malignant regions of the relative color histogram may be applicable to any set of images of benign and malignant lesions.
Figures


References
-
- Friedman RJ, Rigel DS, Kopf AW. Early detection of malignant melanoma: the role of physician examination and self-examination of the skin. Ca-A Cancer J Clin. 1985;35:130–151. - PubMed
-
- Rigel DS. Malignant melanoma: incidence issues and their effect on diagnosis and treatment in the 1990s. Mayo Clin Proc. 1997;72:367–371. - PubMed
-
- Jemal A, Murray T, Samuels A, Ghafoor A, Ward E, Thun MJ. Cancer statistics 2003. Ca-A Cancer Clin. 2003;53:5–26. - PubMed
-
- Argenziano G, Soyer HP, De Giorgi V, Piccolo D. Dermoscopy, an interactive atlas. EDRA Medical Publishing; Milan, Italy: 2000.
-
- Elbaum M, Kopf AW, Rabinovitz HS, Langley RGB, Kamino H, Mihm MC, Sober AJ, Peck GL, Bogdan A. Automatic differentiation of melanoma from melanocytic nevi with multispectral digital dermoscopy: a feasibility study. J Am Acad Dermatol. 2001;44:207–218. - PubMed
Publication types
MeSH terms
Grants and funding
LinkOut - more resources
Full Text Sources
Other Literature Sources
Medical
