

doi: 10.1098/rspb.2006.0015.
What is the best control strategy for multiple infectious disease outbreaks?
Affiliations
- PMID: 17251095
- PMCID: PMC2093965
- DOI: 10.1098/rspb.2006.0015
Item in Clipboard
What is the best control strategy for multiple infectious disease outbreaks?
Proc Biol Sci.
.
Abstract
Effective control of infectious disease outbreaks is an important public health goal. In a number of recent studies, it has been shown how different intervention measures like travel restrictions, school closures, treatment and prophylaxis might allow us to control outbreaks of diseases, such as SARS, pandemic influenza and others. In these studies, control of a single outbreak is considered. It is, however, not clear how one should handle a situation where multiple outbreaks are likely to occur. Here, we identify the best control strategy for such a situation. We further discuss ways in which such a strategy can be implemented to achieve additional public health objectives.
Figures
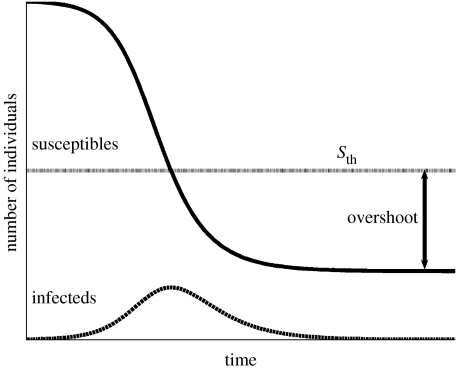
Susceptibles and infecteds for an uncontrolled epidemic. The dotted horizontal line indicates the threshold level of susceptibles Sth below which population immunity prevents further outbreaks. The arrow indicates the difference between the number of susceptibles at the end of the outbreak and Sth. We term this difference the overshoot. (Equations and parameters used to produce all the figures are given in §2.)
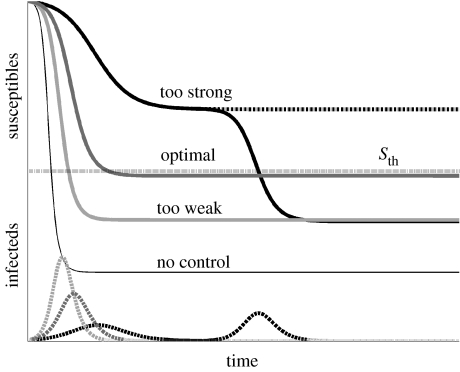
Control strategies of different strength. Susceptibles and infecteds for intervention measures that are too weak (light grey), too strong (black) and optimal (dark grey). Also shown are the susceptibles for the uncontrolled case (thin solid curve) and for the case of strong control in a closed (single outbreak) population (dash-dotted line). (For better illustration purposes, number of infecteds are not drawn to scale.)
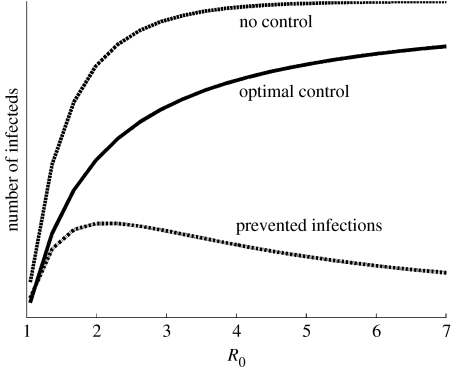
Prevented infections for the optimal control strategy as a function of the basic reproductive number. Also shown are the total number of infecteds for no and optimal control.
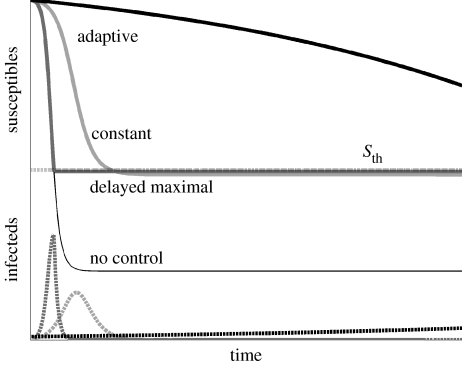
Examples of different control approaches. The light grey curve shows constant intervention. The black curve shows a scenario where intervention measures are constantly adapted such that the effective reproductive number is slightly above 1. The dark grey curve shows the number of susceptibles for the strategy best suited to prevent resistance emergence, namely no intervention until S reaches Sth, followed by maximal reduction of transmission. Also shown are the number of susceptibles without control. (For better illustration purposes, number of infecteds are not drawn to scale.)
References
-
- Anderson R.M, May R.M. Oxford Science Publications; Oxford, UK: 1991. Infectious diseases of humans—dynamics and control.
-
- Behncke H. Optimal control of deterministic epidemics. Opt. Control Appl. Methods. 2000;21:269–285. doi:10.1002/oca.678 - DOI
-
- Beigel J.H, et al. Avian influenza A (H5N1) infection in humans. N. Engl. J. Med. 2005;353:1374–1385. doi:10.1056/NEJMra052211 - DOI - PubMed
-
- Clancy D. Optimal intervention for epidemic models with general infection and removal rate functions. J. Math. Biol. 1999;39:309–331. doi:10.1007/s002850050193 - DOI - PubMed
Publication types
MeSH terms
Grants and funding
LinkOut - more resources
Full Text Sources
Other Literature Sources
Miscellaneous
