

Exogenous re-infection and the dynamics of tuberculosis epidemics: local effects in a network model of transmission
- PMID: 17251134
- PMCID: PMC2373405
- DOI: 10.1098/rsif.2006.0193
Exogenous re-infection and the dynamics of tuberculosis epidemics: local effects in a network model of transmission
Abstract
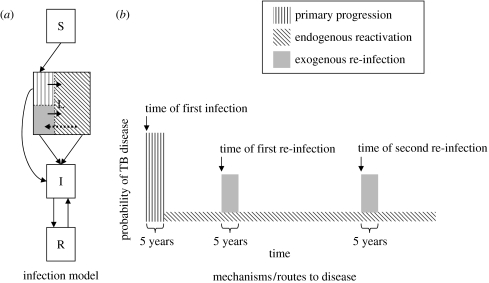
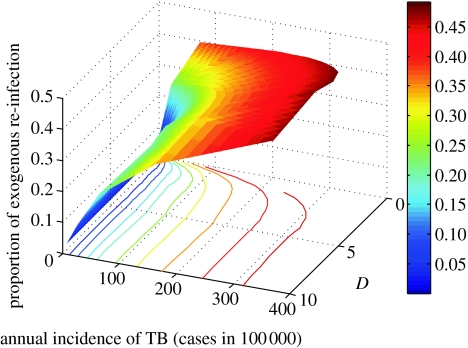
Infection with Mycobacterium tuberculosis leads to tuberculosis (TB) disease by one of the three possible routes: primary progression after a recent infection; re-activation of a latent infection; or exogenous re-infection of a previously infected individual. Recent studies show that optimal TB control strategies may vary depending on the predominant route to disease in a specific population. It is therefore important for public health policy makers to understand the relative frequency of each type of TB within specific epidemiological scenarios. Although molecular epidemiologic tools have been used to estimate the relative contribution of recent transmission and re-activation to the burden of TB disease, it is not possible to use these techniques to distinguish between primary disease and re-infection on a population level. Current estimates of the contribution of re-infection therefore rely on mathematical models which identify the parameters most consistent with epidemiological data; these studies find that exogenous re-infection is important only when TB incidence is high. A basic assumption of these models is that people in a population are all equally likely to come into contact with an infectious case. However, theoretical studies demonstrate that the social and spatial structure can strongly influence the dynamics of infectious disease transmission. Here, we use a network model of TB transmission to evaluate the impact of non-homogeneous mixing on the relative contribution of re-infection over realistic epidemic trajectories. In contrast to the findings of previous models, our results suggest that re-infection may be important in communities where the average disease incidence is moderate or low as the force of infection can be unevenly distributed in the population. These results have important implications for the development of TB control strategies.
Figures
Similar articles
-
Tuberculosis.In: Holmes KK, Bertozzi S, Bloom BR, Jha P, editors. Major Infectious Diseases. 3rd edition. Washington (DC): The International Bank for Reconstruction and Development / The World Bank; 2017 Nov 3. Chapter 11. In: Holmes KK, Bertozzi S, Bloom BR, Jha P, editors. Major Infectious Diseases. 3rd edition. Washington (DC): The International Bank for Reconstruction and Development / The World Bank; 2017 Nov 3. Chapter 11. PMID: 30212088 Free Books & Documents. Review.
-
[Exogenous re-infection in tuberculosis].Kekkaku. 2006 Feb;81(2):79-91. Kekkaku. 2006. PMID: 16529009 Japanese.
-
Transmission dynamics of pulmonary tuberculosis between autochthonous and immigrant sub-populations.BMC Infect Dis. 2009 Dec 4;9:197. doi: 10.1186/1471-2334-9-197. BMC Infect Dis. 2009. PMID: 19961606 Free PMC article.
-
Seasonal dynamics of tuberculosis epidemics and implications for multidrug-resistant infection risk assessment.Epidemiol Infect. 2014 Feb;142(2):358-70. doi: 10.1017/S0950268813001040. Epub 2013 May 16. Epidemiol Infect. 2014. PMID: 23676258 Free PMC article.
-
Will DOTS do it? A reappraisal of tuberculosis control in countries with high rates of HIV infection.Int J Tuberc Lung Dis. 1999 Jun;3(6):457-65. Int J Tuberc Lung Dis. 1999. PMID: 10383056 Review.
Cited by
-
Mathematical modelling, analysis and numerical simulation of social media addiction and depression.PLoS One. 2024 Mar 12;19(3):e0293807. doi: 10.1371/journal.pone.0293807. eCollection 2024. PLoS One. 2024. PMID: 38470872 Free PMC article.
-
Seasonality of active tuberculosis notification from 2005 to 2014 in Xinjiang, China.PLoS One. 2017 Jul 5;12(7):e0180226. doi: 10.1371/journal.pone.0180226. eCollection 2017. PLoS One. 2017. PMID: 28678873 Free PMC article.
-
Info-gap management of public health Policy for TB with HIV-prevalence and epidemiological uncertainty.BMC Public Health. 2012 Dec 19;12:1091. doi: 10.1186/1471-2458-12-1091. BMC Public Health. 2012. PMID: 23249291 Free PMC article.
-
Dynamics of Mycobacterium and bovine tuberculosis in a human-buffalo population.Comput Math Methods Med. 2014;2014:912306. doi: 10.1155/2014/912306. Epub 2014 Sep 2. Comput Math Methods Med. 2014. PMID: 25254065 Free PMC article.
-
Are neighbourhoods of tuberculosis cases a high-risk population for active intervention? A protocol for tuberculosis active case finding.PLoS One. 2021 Aug 13;16(8):e0256043. doi: 10.1371/journal.pone.0256043. eCollection 2021. PLoS One. 2021. PMID: 34388190 Free PMC article.
References
MeSH terms
Grants and funding
LinkOut - more resources
Full Text Sources
