. 2007 Apr 22;4(13):331-40.
doi: 10.1098/rsif.2006.0182.

Individual and gender fingerprints in human body odour

Affiliations

Individual and gender fingerprints in human body odour

Dustin J Penn et al. J R Soc Interface. .

Abstract

Individuals are thought to have their own distinctive scent, analogous to a signature or fingerprint. To test this idea, we collected axillary sweat, urine and saliva from 197 adults from a village in the Austrian Alps, taking five sweat samples per subject over 10 weeks using a novel skin sampling device. We analysed samples using stir bar sorptive extraction in connection with thermal desorption gas chromatograph-mass spectrometry (GC-MS), and then we statistically analysed the chromatographic profiles using pattern recognition techniques. We found more volatile compounds in axillary sweat than in urine or saliva, and among these we found 373 peaks that were consistent over time (detected in four out of five samples per individual). Among these candidate compounds, we found individually distinct and reproducible GC-MS fingerprints, a reproducible difference between the sexes, and we identified the chemical structures of 44 individual and 12 gender-specific volatile compounds. These individual compounds provide candidates for major histocompatibility complex and other genetically determined odours. This is the first study on human axillary odour to sample a large number of subjects, and our findings are relevant to understanding the chemical nature of human odour, and efforts to design electronic sensors (e-nose) for biometric fingerprinting and disease diagnoses.


Figures

Figure 1
Figure 1
Intra- versus inter-individual variation. This empirical cumulative distribution function shows the result of a test using qualitative distance to compare the similarity of GC–MS spectra. AA represents the average distance of the repeats of the same subject (intra-individual) and AB shows the average distance between different subjects (inter-individual). AA is significantly different from AB, and AA is always above AB. The significant Kolmorogov–Smirnoff rank test means that the samples in AA comparisons generally receive a lower rank than those in AB comparisons. This indicates that the repeats of GC–MS spectra of the same subject are more similar to each other than samples from different subjects. A quantitative model shows the same result, and though the difference is also significant (Kolmorogov–Smirnoff rank test, KS statistic=0.321, p=3.74×10⁻¹⁸), it is not as dramatic. This suggests that the intra-individual variation is much smaller using a qualitative distance metric than using a quantitative one.
Figure 2
Figure 2
(a) Scores and (b) loadings plots showing markers that distinguish individuals. This is an example of one family with individuals numbered and coded with coloured symbols in the scores plots. Key peaks are indicated and their retention times listed in the loadings plot. The scores and loadings for principal component analysis on these data are presented: scores provide information about samples (or subjects), whereas loadings provide complementary information about the compounds that characterize these samples.
Figure 3
Figure 3
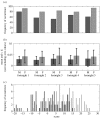
Distributions of markers that distinguish the sexes. (a) The distribution of the marker compound isopropyl hexadecanoate (RT 33.70 min) as the percentage of samples it was detected in and (b) mean and s.d. of the normalized square-root intensity when detected in males and females, over all five fortnights. (c) Distribution of males and females is based on a model using the scoring system (black, male; grey, female). For each fortnight, if the male marker is detected in a specific individual, it is scored as −1, for a female marker it is scored as +1, so an individual scoring +35 contains the strongest possible female fingerprint, whereas an individual scoring −35 the strongest possible male fingerprint. Using a score of five as a divider between the classes, 75% can be correctly classified into their respective genders based on the presence and absence of 14 key markers.

References

    1. Ackerl K, Atzmüller A, Grammer K. The scent of fear. Neuroendocrinol. Lett. 2001;23:79–84. - PubMed
    1. Albone E.S, Gosden P.E, Ware G.C. Bacteria as a source of chemical signals in mammals. In: Müller-Schwarze D, Mozell M.M, editors. Chemical signals in vertebrates. Plenum Press; New York, NY: 1977. p. 35.
    1. Asano K.G, Bayne C.K, Horsman K.M, Buchanan M.V. Chemical composition of fingerprints for gender determination. J. Forensic Sci. 2002;47:805–807. - PubMed
    1. Baltussen E, Cramers C.A, Sandra P.J.F. Sorptive sample preparation—a review. Anal. Bioanal. Chem. 2002;373:3–22. doi: 10.1007/s00216-002-1266-2. - DOI - PubMed
    1. Bernier U.R, Booth M.M, Yost R.A. Analysis of human skin emanations by gas chromatography/mass spectrometry. 1. Thermal desorption of attractants for the yellow fever mosquito (Aedes aegypti) from handled glass beads. Anal. Chem. 1999;71:1–7. doi: 10.1021/ac980990v. - DOI - PubMed

Publication types