. 2007 Apr 22;4(13):283-304.
doi: 10.1098/rsif.2006.0170.

Mathematical models of the VEGF receptor and its role in cancer therapy

Affiliations

Mathematical models of the VEGF receptor and its role in cancer therapy

Tomás Alarcón et al. J R Soc Interface. .

Abstract

We present an analysis of a stochastic model of the vascular endothelial growth factor (VEGF) receptor. This analysis addresses the contribution of ligand-binding-induced oligomerization, activation of src-homology 2 domain-carrying kinases and receptor internalization in the overall behaviour of the VEGF/VEGF receptor (VEGFR) system. The analysis is based upon a generalization of a Wentzel-Kramers-Brillouin (WKB) approximation of the solution of the corresponding master equation. We predict that tumour-mediated overexpression of VEGFRs in the endothelial cells (ECs) of tumour-engulfed vessels leads to an increased sensitivity of the ECs to low concentrations of VEGF, thus endowing the tumour with increased resistance to anti-angiogenic treatment.


Figures

Figure 1
Figure 1
Schematic of our receptor-binding model (table 1) including ligand-induced dimerization (receptor activation). The black rectangles represent the cytoplasmic kinase domains of the receptors. The asterisks denote that the dimerized receptors have undergone cross-phosphorylation and hence provide high-affinity docking sites for SH2 domain-carrying kinases. See text for a definition of keffx.
Figure 2
Figure 2
Schematic of our receptor-binding model (table 3). The black rectangles represent the cytoplasmic kinase domains of the receptors. The asterisks denote that the dimerized receptors have undergone cross-phosphorylation and hence provide high-affinity docking sites for SH2 domain-carrying kinases. See text for a definition of keffis, i=1, … , 4.
Figure 3
Figure 3
Simulation results corresponding to Model 3 with konx=4.6×10³s1 and koffx=103s1, respectively. This plot shows the time course of the proportion of surface dimers for different values of L. Key: solid line corresponds to L=10 nM, dashed line to L=1 nM, dot-dashed line to L=0.1 nM and dotted line to L=0.01 nM. Ligand is introduced at t=0.
Figure 4
Figure 4
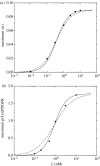
(a) Simulation results corresponding to Model 3 with konx=4.6×10³s1 and koffx=103s1. The squares in this plot show the maximum value achieved by the proportion of surface dimers (figure 3) as a function of ligand concentration. Solid line corresponds to a Hill curve X=XmaxLn/(Kn+Ln) with n=1.2. (b) Experimental results by Park et al. (2003). Solid line corresponds to a Hill curve X=XmaxLn/(Kn+Ln) with n=1.5. In both panels, dashed lines correspond to a Hill curve with n=1, which has been included for comparison. Ligand is introduced at t=0.
Figure 5
Figure 5
Simulation results corresponding to Model 3. These plots show the time course of the proportion of surface dimers bound to SH2 domains (x1, x2, x3 and x4) for L=10−8 M.
Figure 6
Figure 6
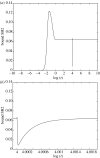
Simulation results corresponding to Model 3. (a) corresponds to results showing the proportion of surface dimers (upper plot) and the proportion of bound SH2 domains (lower plot) without anti-VEGF treatment for L=10 nM. (b) Results from a simulation in which anti-VEGF therapy was implemented by reducing the level of VEGF from L=10 nM to L=0.01 nM at time t=10−2. (c): idem at t=10−3. Parameter values have been taken from table 2.
Figure 7
Figure 7
x* as a function of the dimensionless quantity AL for different values of the dimensionless quantity konx. Parameter values have been taken from table 2. Squares, konx=4.6×10³s1; triangles, konx=4.6×10²s1; and circles, konx=4.6×101s1.
Figure 8
Figure 8
Numerical solution for the first cumulant equations corresponding to Model 2 (table 3). (a) corresponds to log(AL)=−6, panel (b) to log(AL)=1 and (c) to log(AL)=6. Parameter values have been taken from table 2.
Figure 9
Figure 9
Simulation results corresponding to Model 2. (a) corresponds to results showing the proportion of surface dimers (upper plot) and the proportion of bound SH2 domains (lower plot) without anti-VEGF treatment for L=10 nM. (b) Results from a simulation in which anti-VEGF therapy was implemented by reducing the level of VEGF from L=10 to 0.01 nM at time t=10−3. (c): idem at t=104. Parameter values have been taken from table 2.
Figure 10
Figure 10
Simulation results corresponding to Model 2 where the effect of combining anti-VEGF therapy and reduction of konx is demonstrated. Both therapies have been applied at t=104. VEGF concentration has been reduced from L=10 to 0.01 nM. The dimerization rate has been reduced from konx=4.6×10³s1 to konx=4.6×101s1. The rest of the parameter values have been taken from table 2.
Figure 11
Figure 11
Simulation results for Model 4 (equations (5.1)–(5.15)) for a physiological situation. This plot shows the proportion of receptors. Dashed line corresponds to L=10−8 M, solid line to L=10−9 M, dot-dashed line to L=10−10 M and dotted line to L=10−11 M. Parameter values have been taken from table 2.
Figure 12
Figure 12
Simulation results for Model 4 (equations (5.1)–(5.15)) for a physiological situation. This plot shows the number of SH2 domains bound to receptor dimers on the surface of the cell. Solid line corresponds to L=10−8 M, dashed line to L=10−9 M, dot-dashed line to L=10−10 M and dotted line to L=10−18 M. Parameter values have been taken from table 2.
Figure 13
Figure 13
Simulation results for Model 4 (equations (5.1)–(5.15)). This plot shows the proportion of SH2 domains bound to surface receptors dimers. Solid line corresponds to L=10−8 M, dashed line to L=10−9 M, dot-dashed line to L=10−10 M and dotted line L=10−18 M. (a) corresponds to ks=4.5×10⁻⁴ and (b) to ks=9×10⁻⁴. Other parameter values have been taken from table 2.
Figure 14
Figure 14
Simulation results of the effect of anti-VEGF therapy on Model 4 (equations (5.1)–(5.15)) in a physiological situation. The levels of VEGF have been reduced from L=10 to 0.01 nM. (a) corresponds to drug administration at t=10−4 and (b) to administration time t=10−2. Parameter values have been taken from table 2.
Figure 15
Figure 15
Simulation results of the effect of anti-VEGF therapy on Model 4 (equations (5.1)–(5.15)) in a pathological situation. The value of the rate of receptor synthesis has been increased to ks=4.5×10⁻⁴, i.e. fivefold its physiological value. The levels of VEGF have been reduced from L=10 to 0.01 nM. (a) corresponds to an untreated case and (b) to drug administration at t=10−4. Other parameter values have been taken from table 2.
Figure 16
Figure 16
Simulation results of the effect of anti-VEGF therapy on Model 4 (equations (5.1)–(5.15)) in a physiological situation. The levels of VEGF have been reduced from L=10 to 0.01 nM. (a) corresponds to drug administration at t=104 and (b) to a close-up of (a). Parameter values have been taken from table 2.
Figure 17
Figure 17
Variance of x for Model 1 (table 1) calculated at the steady state shown on a logarithmic scale. Circles correspond to konx=4.6×10²s1 and triangles to konx=4.6×10²s1. Parameter values have been taken from table 2.
Figure 18
Figure 18
(a) Simulation results corresponding to Models 3 and 4 (with ks=9×10⁻⁵ s−1). The squares (Model 3) and triangles (Model 4) in this plot show the maximum values achieved by the proportion of surface dimers (figure 3) as a function of ligand concentration when the models were simulated until t=1.2, i.e. 20 min in dimensional terms. (b) Experimental results by Cai et al. (2006).

References

    1. Alarcón T, Page K.M. Stochastic models of receptor oligomerization by bivalent ligand. J. R. Soc. Interface. 2006;3:545–559. doi: 10.1098/rsif.2006.0116. - DOI - PMC - PubMed
    1. Alberts B, Johnson A, Lewis J, Raff M, Roberts K, Walter P. Garland Publishing; New York, NY: 2002. Molecular biology of the cell.
    1. Amlal H, Faroqui S, Balasubramaniam A, Sheriff S. Estrogen up-regulates neuropeptide YY1 receptor expression in a human breast cancer cell line. Cancer Res. 2006;66:3706–3714. doi: 10.1158/0008-5472.CAN-05-2744. - DOI - PubMed
    1. Berger G, Benjamin L.E. Tumorigenesis and the angiogenic switch. Nature Rev. Cancer. 2003;3:401–410. doi: 10.1038/nrc1093. - DOI - PubMed
    1. Cai J, Jians W.G, Ahmed A, Bulton M. Vascular endothelial growth factor induced cells proliferation is regulated by interaction between VEGFR-s, SH-PTP1 and eNOS. Microvasc. Res. 2006;71:20–31. doi: 10.1016/j.mvr.2005.10.004. - DOI - PubMed

Publication types

MeSH terms

Substances

LinkOut - more resources