. 2007 Apr;81(7):3465-76.
doi: 10.1128/JVI.02392-06. Epub 2007 Jan 24.

Subdominant CD8+ T-cell responses are involved in durable control of AIDS virus replication

Affiliations

Subdominant CD8+ T-cell responses are involved in durable control of AIDS virus replication

Thomas C Friedrich et al. J Virol. 2007 Apr.

Abstract

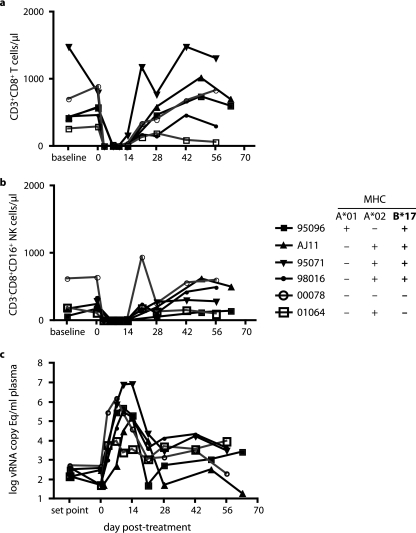
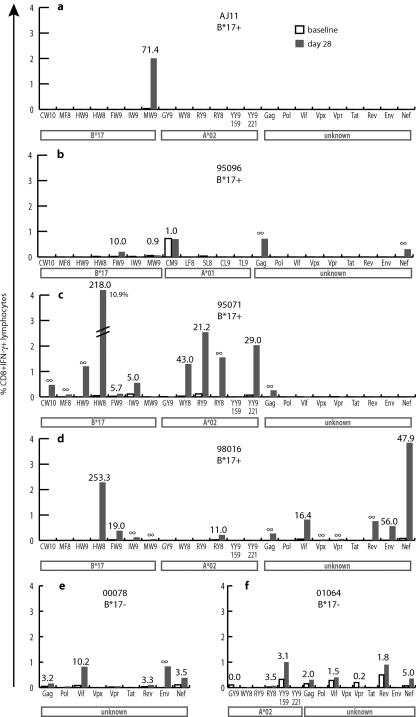
"Elite controllers" are individuals that durably control human immunodeficiency virus or simian immunodeficiency virus replication without therapeutic intervention. The study of these rare individuals may facilitate the definition of a successful immune response to immunodeficiency viruses. Here we describe six Indian-origin rhesus macaques that have controlled replication of the pathogenic virus SIVmac239 for 1 to 5 years. To determine which lymphocyte populations were responsible for this control, we transiently depleted the animals' CD8+ cells in vivo. This treatment resulted in 100- to 10,000-fold increases in viremia. When the CD8+ cells returned, control was reestablished and the levels of small subsets of previously subdominant CD8+ T cells expanded up to 2,500-fold above pre-depletion levels. This wave of CD8+ T cells was accompanied by robust Gag-specific CD4 responses. In contrast, CD8+ NK cell frequencies changed no more than threefold. Together, our data suggest that CD8+ T cells targeting a small number of epitopes, along with broad CD4+ T-cell responses, can successfully control the replication of the AIDS virus. It is likely that subdominant CD8+ T-cell populations play a key role in maintaining this control.


Figures

FIG. 1.
FIG. 1.
Dynamics of CD8+ T cells and SIV replication in ECs treated with monoclonal antibody cM-T807. Animals were given 50 mg/kg of antibody on day 0. (a) CD3+, CD8+ T-cell dynamics. (b) CD3, CD8+, CD16+ NK cell dynamics. The NK cell count for animal 95071 at the predepletion time point is unavailable due to a technical error. (c) Virus replication kinetics. Set point indicates the geometric mean virus load for each animal from 12 weeks postinfection until CD8+ cell depletion. Black lines and filled symbols indicate ECs expressing the MHC class I allele Mamu-B*17. ECs that did not express this allele are represented with gray lines and open symbols.
FIG. 2.
FIG. 2.
Dynamics of CD8+ T-cell responses enumerated by tetramer staining. PBMC were stained with tetramers loaded with the indicated peptides before (white bars) and 21 days after (gray bars) depletion, at which time CD8 cell counts had returned nearly to normal. Numbers above bars indicate changes (n-fold) in the magnitude of responses between baseline and day 21. Tetramers were available for the MHC class I molecules Mamu-A*01, Mamu-A*02, and Mamu-B*17. Animal 00078 did not express any of the corresponding alleles, so data for this animal are not shown.
FIG. 3.
FIG. 3.
Expansion of a subset of CD8+ T-cell responses after the depletion of Mamu-B*17-positive and -negative ECs of CD8+ cells. PBMC were stimulated with synthetic peptides representing minimal optimal Mamu-A*01-, Mamu-A*02-, or Mamu-B*17-restricted epitopes or pools of 15-mer peptides representing the entire SIVmac239 proteome and stained for intracellular accumulation of IL-2 and IFN-γ 1 month prior to (white bars) and 28 days after (gray bars) CD8 cell depletion. Responses to individual minimal optimal peptides are indicated according to the presenting MHC class I molecule. In each case, responses stimulated by the minimal optimal peptide were also detected using the corresponding 15-mer pool (data not shown); responses to these pools were subtracted from the data presented here. Responses to 15-mer pools that did not contain previously identified minimal optimal epitope sequences are summed for each protein and indicated as “unknown.” Due to the limited availability of PBMC prior to depletion, cells from animals 95096 and AJ11 were stimulated with epitope peptides only.
FIG. 4.
FIG. 4.
Expansion of SIV-specific CD4+ T-cell responses following the depletion of ECs of CD8+ cells. PBMC were stimulated with pools of 10 to 50 overlapping 15-mer peptides spanning the entire SIVmac239 proteome 1 month before (white bars) and 28 days after (gray bars) the depletion of ECs of peripheral CD8+ cells. Each column represents the frequency of CD4+, IFN-γ+ lymphocytes responding to one peptide pool. CD4+ T-cell response data for animals 95096 and AJ11 prior to depletion are not available due to the limited availability of PBMC.
FIG. 5.
FIG. 5.
Ex vivo assay for functions of CD8+ lymphocyte subsets. Representative results from the coculture of infected, autologous target cells with the indicated effector cell populations are shown. Total PBMC, PBMC depleted of NK cells, PBMC depleted of CD8+ T cells (CD8T), or PBMC depleted of all CD8+ cells were used as effectors at a ratio of approximately 3:1 in a 7-day assay. Cells were stained for p27 Gag expression; the percentage of CD8 cells positive for Gag expression is indicated in each panel. Quantitation of SIV vRNA in supernatants confirmed these results (data not shown).
FIG. 6.
FIG. 6.
Sequence variation in epitopes restricted by Mamu-A*01, Mamu-A*02, and Mamu-B*17 in recrudescent virus in ECs. For each animal, locations of epitopes recognized upon the return of CD8+ T cells after depletion are mapped onto the viral proteome. Solid lines represent responses to individual minimal optimal epitopes detected by both tetramers and IFN-γ secretion. Vertical boxes, e.g., that corresponding to animal 95071 for Nef YY9-159, indicate responses detected by tetramers but not by IFN-γ secretion. Variation in known epitopes is represented by circles.

References

    1. Alexander, L., E. Weiskopf, T. C. Greenough, N. C. Gaddis, M. R. Auerbach, M. H. Malim, S. J. O'Brien, B. D. Walker, J. L. Sullivan, and R. C. Desrosiers. 2000. Unusual polymorphisms in human immunodeficiency virus type 1 associated with nonprogressive infection. J. Virol. 74:4361-4376. - PMC - PubMed
    1. Allen, T. M., M. Altfeld, X. G. Yu, K. M. O'Sullivan, M. Lichterfeld, S. Le Gall, M. John, B. R. Mothe, P. K. Lee, E. T. Kalife, D. E. Cohen, K. A. Freedberg, D. A. Strick, M. N. Johnston, A. Sette, E. S. Rosenberg, S. A. Mallal, P. J. Goulder, C. Brander, and B. D. Walker. 2004. Selection, transmission, and reversion of an antigen-processing cytotoxic T-lymphocyte escape mutation in human immunodeficiency virus type 1 infection. J. Virol. 78:7069-7078. - PMC - PubMed
    1. Allen, T. M., B. R. Mothe, J. Sidney, P. Jing, J. L. Dzuris, M. E. Liebl, T. U. Vogel, D. H. O'Connor, X. Wang, M. C. Wussow, J. A. Thomson, J. D. Altman, D. I. Watkins, and A. Sette. 2001. CD8(+) lymphocytes from simian immunodeficiency virus-infected rhesus macaques recognize 14 different epitopes bound by the major histocompatibility complex class I molecule mamu-A*01: implications for vaccine design and testing. J. Virol. 75:738-749. - PMC - PubMed
    1. Barassi, C., A. Lazzarin, and L. Lopalco. 2004. CCR5-specific mucosal IgA in saliva and genital fluids of HIV-exposed seronegative subjects. Blood 104:2205-2206. - PubMed
    1. Betts, M. R., B. Exley, D. A. Price, A. Bansal, Z. T. Camacho, V. Teaberry, S. M. West, D. R. Ambrozak, G. Tomaras, M. Roederer, J. M. Kilby, J. Tartaglia, R. Belshe, F. Gao, D. C. Douek, K. J. Weinhold, R. A. Koup, P. Goepfert, and G. Ferrari. 2005. Characterization of functional and phenotypic changes in anti-Gag vaccine-induced T cell responses and their role in protection after HIV-1 infection. Proc. Natl. Acad. Sci. USA 102:4512-4517. - PMC - PubMed

Publication types

MeSH terms