. 2007 Apr;81(7):3477-86.
doi: 10.1128/JVI.01552-06. Epub 2007 Jan 24.

Distinct transcriptional profiles in ex vivo CD4+ and CD8+ T cells are established early in human immunodeficiency virus type 1 infection and are characterized by a chronic interferon response as well as extensive transcriptional changes in CD8+ T cells

Affiliations

Distinct transcriptional profiles in ex vivo CD4+ and CD8+ T cells are established early in human immunodeficiency virus type 1 infection and are characterized by a chronic interferon response as well as extensive transcriptional changes in CD8+ T cells

Martin D Hyrcza et al. J Virol. 2007 Apr.

Abstract

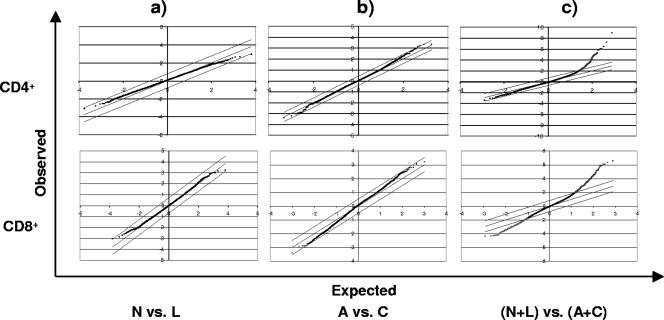
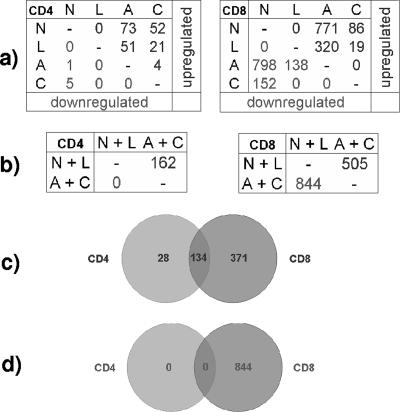
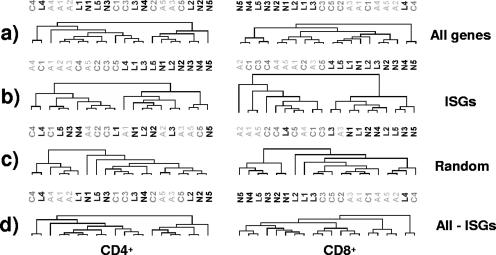
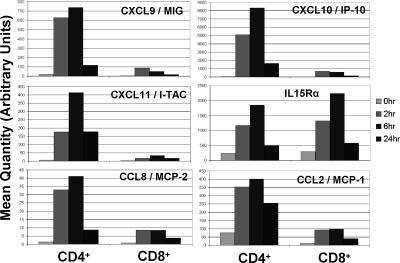
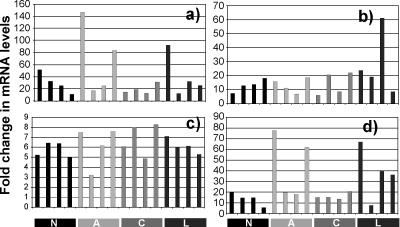
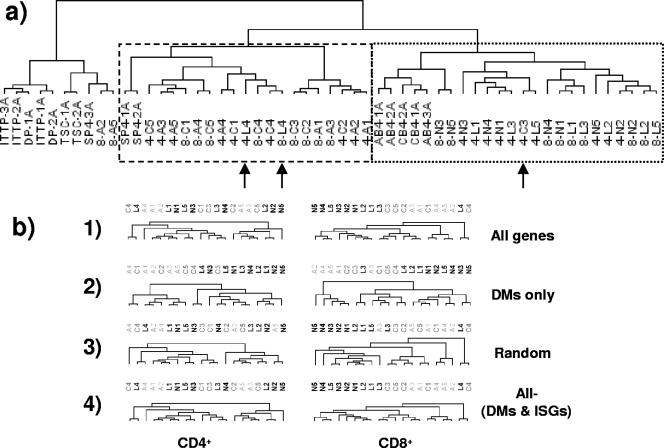
Changes in T-cell function are a hallmark of human immunodeficiency virus type 1 (HIV-1) infection, but the pathogenic mechanisms leading to these changes are unclear. We examined the gene expression profiles in ex vivo human CD4+ and CD8+ T cells from untreated HIV-1-infected individuals at different clinical stages and rates of disease progression. Profiles of pure CD4+ and CD8+ T-cell subsets from HIV-1-infected nonprogressors with controlled viremia were indistinguishable from those of individuals not infected with HIV-1. Similarly, no gene clusters could distinguish T cells from individuals with early infection from those seen in chronic progressive HIV-1 infection, whereas differences were observed between uninfected individuals or nonprogressors versus early or chronic progressors. In early and chronic HIV-1 infection, three characteristic gene expression signatures were observed. (i) CD4+ and CD8+ T cells showed increased expression of interferon-stimulated genes (ISGs). However, some ISGs, including CXCL9, CXCL10, and CXCL11, and the interleukin-15 alpha receptor were not upregulated. (ii) CD4+ and CD8+ T cells showed a cluster similar to that observed in thymocytes. (iii) More genes were differentially regulated in CD8+ T cells than in CD4+ T cells, including a cluster of genes downregulated exclusively in CD8+ T cells. In conclusion, HIV-1 infection induces a persistent T-cell transcriptional profile, early in infection, characterized by a dramatic but potentially aberrant interferon response and a profile suggesting an active thymic output. These findings highlight the complexity of the host-virus relationship in HIV-1 infection.


Figures

FIG. 1.
FIG. 1.
SAM analysis of 20 CD4+ and 20 CD8+ samples across four clinical groups. Two-class SAM analysis was performed with 300 permutations. False discovery rate brackets of 5% were selected. The points outside the broken lines represent significantly upregulated genes (above the upper line) and downregulated genes (below the lower line). CD4+ and CD8+ T-cell transcriptional profiles revealed no significant differences between long-term nonprogressors (L) and uninfected individuals (N) (a) and only four genes differentiated between early (A) and chronic (C) infection (b); however, when combined cohorts were compared, large differences between L and N samples and A and C samples were observed (c).
FIG. 2.
FIG. 2.
Summary of SAM analysis. Numbers of genes found significant by SAM in various two-class, unpaired comparisons are shown. The groups represented by the letters in the upper horizontal bars in panels a and b were analyzed with respect to the groups represented in the vertical bars. Upregulated genes are shown in dark gray and downregulated genes in light gray (e.g., 52 genes were found upregulated in CD4+ T cells of chronic progressors [C] compared to those of uninfected donors [N]). (a) Each of the four clinical groups was subjected to pairwise analysis in comparisons to each other group. (b) N and L groups were combined and analyzed in comparison to a combined A and C group. (c and d) Breakdown of genes upregulated (c) and downregulated (d) in A and C samples compared to N and L samples into those occurring in CD4+ and CD8+ T-cell subsets.
FIG. 3.
FIG. 3.
Hierarchical clustering of gene expression profiles from CD4+ and CD8+ T-cell samples. The following sets of genes were used in clustering: (a) all genes; (b) only ISGs; (c) a random sample of genes equivalent in number to but excluding the genes represented in panel b; (d) all genes except ISGs. Samples: N, uninfected; L, long-term nonprogressors; A, early infection; C, chronic infection.
FIG. 4.
FIG. 4.
IFN-α2b-mediated induction of selected genes in primary CD4+ and CD8+ T cells. Purified CD4+ and CD8+ T cells, obtained from two uninfected donors, were treated in vitro with IFN-α2b for 0, 2, 6, and 24 h. The mRNA levels of CXCL9, CXCL10, CXCL11, CCL2, CCL8, and IL-15Rα were determined by RT qPCR and quantified relative to the expression of a housekeeping gene (TATA-binding protein).
FIG. 5.
FIG. 5.
IFN response in donor samples. PBMC samples from 16 donors were treated with IFN-α2b for 4.5 h, and the induction of interferon response was monitored by measuring the changes in the amount of mRNAs of the four selected ISGs by RT qPCR. Each bar represents the fold increase of a given mRNA in one clinical sample. Samples: N, uninfected; L, long-term nonprogressor; A, early infection; C, chronic infection. Genes: (a) IFI44; (b) CD38; (c) IFI16; (d) IFI44L.
FIG. 6.
FIG. 6.
Thymocyte development markers in CD4+ and CD8+ T-cell profiles. (a) Hierarchical clustering of the gene expression profiles from our study with those from a study by Lee et al. (20) of various thymocyte and T-cell populations by use of the cluster of immaturity markers identified in Lee et al. Abbreviations from Lee study: ITTP, intrathymic precursors; DP, dual-positive thymocytes (CD4+ CD8+); SP4, single-positive CD4+ thymocytes; CD4, cord blood CD4s; AB4, adult blood CD4s; TSC, thymic stroma cells. Abbreviations from our study: 8, CD8+ T-cell sample; 4, CD4+ T-cell sample. Samples from participant L4 and the CD4+ sample from participant C3 did not cluster with the majority of their respective clinical groups (arrows). (b) Hierarchical clustering of gene expression profiles from CD4+ and CD8+ T-cell samples using all genes (row 1); only DMs (row 2); a random sample of genes equivalent in number to but excluding those in row 2 (row 3); and all genes except DMs and ISGs (row 4). Samples: N, uninfected; L, long-term nonprogressor; A, early infection; C, chronic infection.

References

    1. Audigé, A., M. Urosevic, E. Schlaepfer, R. Walker, D. Powell, S. Hallenberger, H. Joller, H.-U. Simon, R. Dummer, and R. F. Speck. 2006. Anti-HIV state but not apoptosis depends on IFN signature in CD4+ T cells. J. Immunol. 177:6227-6237. - PubMed
    1. Bentwich, Z., A. Kalinkovich, Z. Weisman, and Z. Grossman. 1998. Immune activation in the context of HIV infection. Clin. Exp. Immunol. 111:1-2. - PMC - PubMed
    1. Bogdan, C., J. Mattner, and U. Schleicher. 2004. The role of type I interferons in non-viral infections. Immunol. Rev. 202:33-48. - PubMed
    1. Bosinger, S. E., K. A. Hosiawa, M. J. Cameron, D. Persad, L. Ran, L. Xu, M. R. Boulassel, M. Parenteau, J. Fournier, E. W. Rud, and D. J. Kelvin. 2004. Gene expression profiling of host response in models of acute HIV infection. J. Immunol. 173:6858-6863. - PubMed
    1. Brassard, D. L., M. M. Delorenzo, S. Cox, D. W. Leaman, Y. Sun, W. Ding, S. Gavor, J. Spond, F. Goodsaid, R. Bordens, and M. J. Grace. 2004. Regulation of gene expression by pegylated IFN-α2b and IFN-α2b in human peripheral blood mononuclear cells. J. Interferon Cytokine Res. 24:455-469. - PubMed

Publication types

MeSH terms

Associated data